FOMC decision day: Sitting tight or cutting deep?
FOMC decision day: Sitting tight or cutting deep?
The Fed is on deck.
Later today, the FOMC will announce its latest decision on interest rates. While some policymakers and political voices are pushing for aggressive cuts, market expectations tell a different story. Based on the CME FedWatch Tool powered by QuikStrike, most participants anticipate the Fed will hold steady, at least until September.
Inflation data appears to support a more dovish stance. The year-over-year change in the Consumer Price Index continues to decelerate, suggesting that price pressures are finally cooling. At the same time, the four-week moving average of initial jobless claims is nearing a potential breakout to the upside. A shift like this could add fuel to the case for rate cuts.
But it’s not that simple.
Tariff concerns and rising oil prices introduce new variables. These could reverse some of the progress on inflation by putting renewed pressure on consumer prices, an outcome that complicates the Fed’s calculus.
For now, the market seems less concerned with inflation and more preoccupied with growing global instability. Whether that’s geopolitical risk, supply chain volatility, or political uncertainty, the narrative is evolving.
The Fed may sit tight today, but pressure is building beneath the surface.
Bollinger bands and market stress
Ongoing instability in the Middle East is weighing on the S&P 500. In moments like this, it’s easy to get swept up in emotion and uncertainty. That’s exactly when discipline matters most.
One tool that helps cut through the noise? Bollinger Bands.
We’ve just come through a period of unusually tight band width, visible in the lower red line on the chart. These compression phases don’t last long. When the bands start to expand, it’s usually in response to a breakout, either higher or lower.
Right now, the S&P 500 is sitting near the middle band, around the 5949 level. That’s our key support. If the index holds here, we could see a bounce and a move toward testing the upper band. But if that level fails, the lower band becomes a real risk, increasing the probability of a deeper retest.
This isn’t about prediction, it’s about preparation.
Use these levels to potentially help calibrate your risk management system and stay grounded in the process, not the panic.
The carry trade you’re not watching
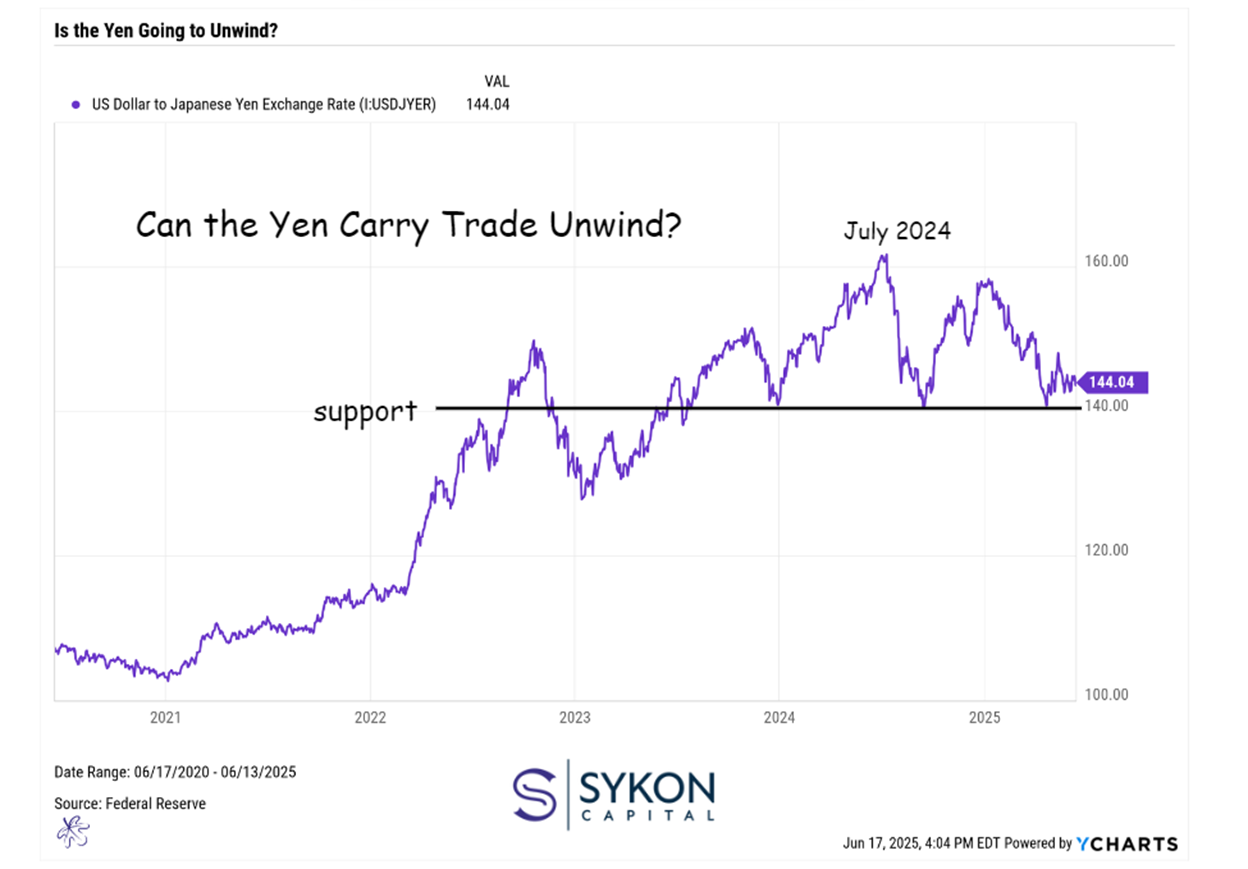
Most investors aren’t watching the USD/JPY exchange rate, but they should be.
The yen carry trade, borrowing in yen to buy U.S. risk assets, has quietly added leverage to the financial system. With ultra-low rates in Japan, it’s been a cheap way to gain exposure to high-flying stocks, especially the Magnificent 7.
But when the yen strengthens, that trade can unravel fast.
Back in July 2024, the yen rallied from over 160 to 140 in a matter of weeks. That move coincided with a sharp pullback in Nasdaq names, as investors unwound positions and repatriated capital back to yen.
Now, rising oil prices, especially problematic for Japan’s import-heavy economy, could spark another unwind. And with it, more market volatility.
Keep your eyes on the 140 level. It’s not just a currency chart; it’s a risk trigger.
Unlock exclusive gold and silver trading signals and updates that most investors don’t see. Join our free newsletter now!
Unlock exclusive gold and silver trading signals and updates that most investors don’t see. Join our free newsletter now!
Author

CMT Association Research Team
CMT Association
The CMT Association is a global credentialing body that has served the financial industry for nearly 50 years.


