FOMC day [Video]
![FOMC day [Video]](https://editorial.fxstreet.com/images/Macroeconomics/CentralBanks/FED/new-us-2013-100-bill-federal-reserve-seal-extreme-macro-28149984_XtraLarge.jpg)
US Dollar: Mar '22 USD is Up at 96.070.
Energies: Mar '22 Crude is Up at 86.12.
Financials: The Mar '22 30 Year bond is Down 2 ticks and trading at 155.06.
Indices: The Mar '22 S&P 500 emini ES contract is 212 ticks Higher and trading at 4402.00.
Gold: The Feb'22 Gold contract is trading Down at 1845.90. Gold is 66 ticks Lower than its close.
Initial conclusion
This is not a correlated market. The dollar is Up, and Crude is Up which is not normal, but the 30-year Bond is trading Lower. The Financials should always correlate with the US dollar such that if the dollar is lower, then the bonds should follow and vice-versa. The S&P is Higher, and Crude is trading Higher which is not correlated. Gold is trading Lower which is correlated with the US dollar trading Up. I tend to believe that Gold has an inverse relationship with the US Dollar as when the US Dollar is down, Gold tends to rise in value and vice-versa. Think of it as a seesaw, when one is up the other should be down. I point this out to you to make you aware that when we don't have a correlated market, it means something is wrong. As traders you need to be aware of this and proceed with your eyes wide open. Currently Asia is trading mainly Higher with the exception of the Aussie and Nikkei exchanges which are Higher. Currently all of Europe is trading Higher.
Possible challenges to traders today
-
Goods Trade Balance is out at 8:30 AM EST. This is Major.
-
Prelim Wholesale Inventories is out at 8:30 AM EST. Major.
-
New Home Sales is out at 10 AM EST. This is Major.
-
Crude Oil Inventories is out at 10:30 AM EST. This is Major.
-
FOMC Statement is out at 2 PM EST. This is Major.
-
Federal Funds Rate is out at 2 PM EST. This is Major.
-
FOMC Press Conference starts at 2:30 PM EST. This is Major
Treasuries
Traders, please note that we've changed the Bond instrument from the 30 year (ZB) to the 10 year (ZN). They work exactly the same.
We've elected to switch gears a bit and show correlation between the 10-year bond (ZN) and the S&P futures contract. The S&P contract is the Standard and Poor's, and the purpose is to show reverse correlation between the two instruments. Remember it's likened to a seesaw, when up goes up the other should go down and vice versa.
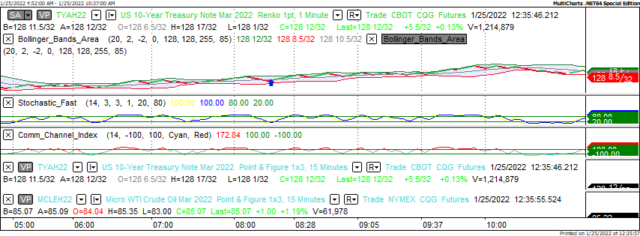
Yesterday the ZN made its move at around 8:20 AM EST. The ZN hit a Low around that time and the S&P moved Lower. If you look at the charts below ZN gave a signal at around 8:20 AM EST and the S&P moved Lower at around the same time. Look at the charts below and you'll see a pattern for both assets. ZN hit a Low at around 8:20 AM EST and the S&P was moving Lower shortly thereafter. These charts represent the newest version of MultiCharts and I've changed the timeframe to a 15-minute chart to display better. This represented a Long opportunity on the 10-year note, as a trader you could have netted about 20 ticks per contract on this trade. Each tick is worth $15.625. Please note: the front month for the ZN is now Mar '22. The S&P contract is now Mar '22 as well. I've changed the format to Renko bars such that it may be more apparent and visible.
Charts courtesy of MultiCharts built on an AMP platform
ZN - Mar 2022 - 01/25/22
-637787926290734870.png)
S&P - Mar 2022 - 01/25/22
Bias
Yesterday we gave the markets a Neutral Bias as we saw no clear direction from a Market Correlation perspective. Half the instruments were Higher and the other half Lower. The Dow traded Lower by 67 points and the other indices traded Lower as well. Given that today is FOMC Day our bias is Neutral as is our custom on this day.
Could this change? Of Course. Remember anything can happen in a volatile market.
Commentary
Yesterday morning we saw no clear direction as half the instruments we use for Market Correlation purposes were pointed Higher and the other half Lower, hence the Neutral bias. Today the Federal Reserve meets to discuss interest rates. Do we think that the FOMC will raise? No, not at this juncture however come March that may well be a different scenario as The Fed has stated previous that come March they will. There are two days during any month that we will always maintain a Neutral or Mixed bias and that si Jobs Friday and FOMC Day. Why? Because the markets have never shown any sense of normalcy on those days and could in fact go anywhere.
Author

Nick Mastrandrea
Market Tea Leaves


