FOMC day [Video]
![FOMC day [Video]](https://editorial.fxstreet.com/images/Macroeconomics/MonetaryPolicy/FED/washington-dc-federal-reserve-headquarters-close-up-38866062_XtraLarge.jpg)
US Dollar: Dec '21 USD is Down at 93.180.
Energies: Nov '21 Crude is Up at 71.65.
Financials: The Dec '21 30 Year bond is Down 10 ticks and trading at 163.14.
Indices: The Dec '21 S&P 500 emini ES contract is 101 ticks Lower and trading at 4368.50.
Gold: The Dec'21 Gold contract is trading Down at 1774.40. Gold is 42 ticks Lower than its close.
Initial conclusion
This is not a correlated market. The dollar is Down and Crude is Up which is normal and the 30 year Bond is trading Lower. The Financials should always correlate with the US dollar such that if the dollar is lower then bonds should follow and vice-versa. The S&P is Higher and Crude is trading Higher which is not correlated. Gold is trading Lower which is not correlated with the US dollar trading Down. I tend to believe that Gold has an inverse relationship with the US Dollar as when the US Dollar is down, Gold tends to rise in value and vice-versa. Think of it as a seesaw, when one is up the other should be down. I point this out to you to make you aware that when we don't have a correlated market, it means something is wrong. As traders you need to be aware of this and proceed with your eyes wide open. Currently Asia is trading mainly Lower with only the Shanghai and Hang Seng in positive territory. All of Europe is trading Higher at this time.
Possible challenges to traders today
-
Existing Home Sales is out at 10 AM EST. This is Major.
-
Crude Oil Inventories are out at 10:30 AM EST. This is Major.
-
FOMC Economic Projections is out at 2 PM EST. This is Major.
-
FOMC Statement is out at 2 PM EST. This is Major.
-
Federal Funds Rate is out at 2 PM EST. This is Major.
-
FOMC Press Conference starts at 2:30 PM EST. This is Major.
Treasuries
Traders please note that we've changed the Bond instrument from the 30 year (ZB) to the 10 year (ZN). They work exactly the same.
We've elected to switch gears a bit and show correlation between the 10 year bond (ZN) and The S&P futures contract. The S&P contract is the Standard and Poor's and the purpose is to show reverse correlation between the two instruments. Remember it's liken to a seesaw, when up goes up the other should go down and vice versa.
Yesterday the ZN made it's move at around 11 AM EST. The ZN hit a High at around that time and the S&P moved Higher. If you look at the charts below ZN gave a signal at around 11 AM EST and the S&P moved Higher at around the same time. Look at the charts below and you'll see a pattern for both assets. ZN hit a High at around 11 AM EST and the S&P was moving Higher shortly thereafter. These charts represent the newest version of MultiCharts and I've changed the timeframe to a 15 minute chart to display better. This represented a Shorting opportunity on the 10 year note, as a trader you could have netted about a dozen ticks per contract on this trade. Each tick is worth $15.625. Please note: the front month for the ZN is now Dec '21. The S&P contract is now Dec '21 as well. I've changed the format to Renko bars such that it may be more apparent and visible.
Charts Courtesy of MultiCharts built on an AMP platform
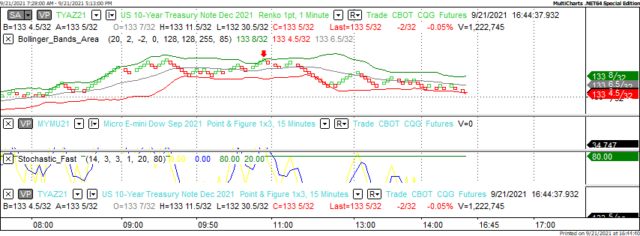
ZN - Dec 2021 - 9/21/21
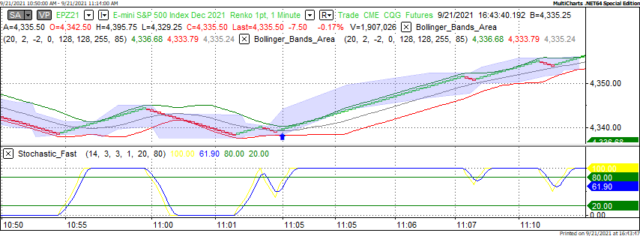
S&P - Dec 2021 - 9/21/21
Bias
Yesterday we gave the markets an Upside bias as USD and Bonds were trading Lower and that usually represents an Upside day. The markets however had other ideas as the Dow dropped 51 points, the S&P dropped 4 but the Nasdaq gained 32. Given that today is FOMC Day, our bias is Neutral.
Could this change? Of Course. Remember anything can happen in a volatile market.
Commentary
Yesterday we were very confident that the markets would rebound as the indices were correlated that way, the European markets were Higher and the economic news reported was positive. The markets had other ideas and even though the indices did trade in positive territory for most of the session, in the final minutes it withdrew into negative territory for the Dow and S&P. Today we have the FOMC Meeting where the powers that be will determine interest rates. I do not expect that the Fed will do anything foolish and hike rates prematurely. They know we are in the midst of a pandemic and that economic conditions (although improving) are not quite where they should be. As such our bias is Neutral today as the markets have never behaved with any sense of normalcy on this day.
Author

Nick Mastrandrea
Market Tea Leaves


