FOMC Day [Video]
![FOMC Day [Video]](https://editorial.fxstreet.com/images/Macroeconomics/CentralBanks/FED/federal-reserve-bank-60556630_XtraLarge.jpg)
US Dollar: Dec USD is Up at 97.490.
Energies: Jan'20 Crude is Down at 59.10.
Financials: The Mar'20 30 year bond is Up 10 ticks and trading at 158.12.
Indices: The Dec S&P 500 emini ES contract is 2 ticks Lower and trading at 3135.50.
Gold: The Feb'20 Gold contract is trading Up at 1471.60. Gold is 35 ticks Higher than its close.
Initial Conclusion
This is not a correlated market. The dollar is Up+ and Crude is Down- which is normal and the 30 year Bond is trading Higher. The Financials should always correlate with the US dollar such that if the dollar is lower then bonds should follow and vice-versa. The S&P is Lower and Crude is trading Lower which is not correlated. Gold is trading Higher which is not correlated with the US dollar trading Up. I tend to believe that Gold has an inverse relationship with the US Dollar as when the US Dollar is down, Gold tends to rise in value and vice-versa. Think of it as a seesaw, when one is up the other should be down. I point this out to you to make you aware that when we don't have a correlated market, it means something is wrong. As traders you need to be aware of this and proceed with your eyes wide open.
At this time Asia is trading mainly Higher with the exception of the Japanese Nikkei exchange which is Lower at this time. Currently Europe is trading Mixed.
Possible Challenges To Traders Today:
-
CPI is out at 8:30 AM EST. This is Major.
-
Core CPI is out at 8:30 AM EST. This is Major.
-
Crude Oil Inventories is out at 10:30 AM EST. This is Major.
-
FOMC Economic Projections is out at 2 PM EST. This is Major.
-
FOMC Statement is out at 2 PM EST. This is Major.
-
Federal Funds Rate is out at 2 PM EST. This is Major.
-
Federal Budget Balance is out at 2 PM EST. This is Major.
-
FOMC Press Conference starts at 2:30 PM EST. This is Major.
Treasuries
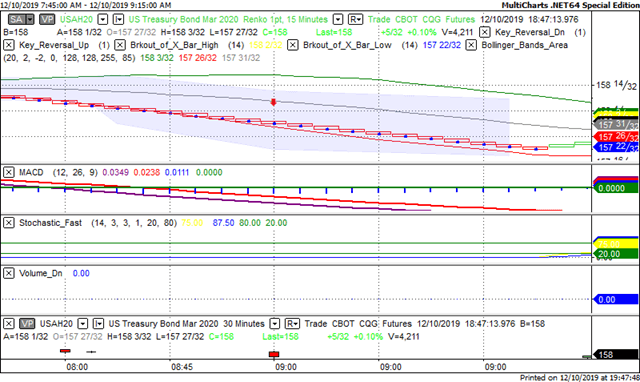
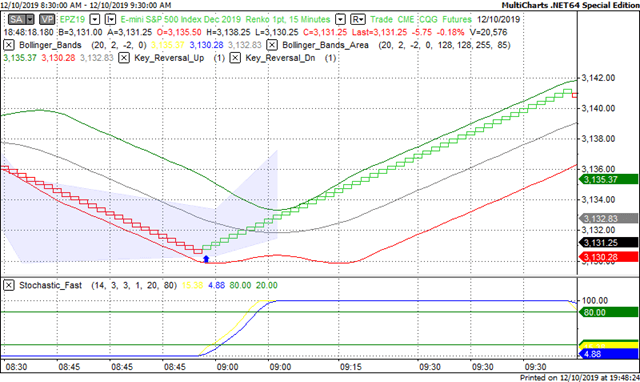
We've elected to switch gears a bit and show correlation between the 30 year bond (ZB) and The S&P futures contract. The S&P contract is the Standard and Poor's and the purpose is to show reverse correlation between the two instruments. Remember it's liken to a seesaw, when up goes up the other should go down and vice versa.
Yesterday the ZB made a major move at around 9 AM EST. The ZB hit a High at around that time and the S&P moved Higher. If you look at the charts below ZB gave a signal at around 9 AM EST and the S&P moved Higher at the same time. Look at the charts below and you'll see a pattern for both assets. ZB hit a High at around 9 AM and the S&P was moving Higher shortly thereafter. These charts represent the newest version of MultiCharts and I've changed the timeframe to a 15 minute chart to display better. This represented a Shorting opportunity on the 30 year bond, as a trader you could have netted about 15 ticks per contract on this trade. Each tick is worth $31.25. Please note: the front month for the ZB is now March '20. The S&P contract is still December. I've changed the format to Renko bars such that it may be more apparent and visible.
Charts Courtesy of MultiCharts built on an AMP platform
Bias
Yesterday we gave the markets a Neutral bias as we didn't see much in the way of correlation. The Dow dropped 28 points and the other indices lost ground as well. Given that today is FOMC Day, we will maintain a Neutral bias.
Could this change? Of Course. Remember anything can happen in a volatile market.
Commentary
So yesterday we maintained a Neutral bias and the House released two articles of impeachment against President Trump and a new NAFTA Treaty was ratified by the House. Either one of these could have driven the markets either way high of low but that didn't happen as the markets remained pretty much in even kneel territory most of the day. Today is of course FOMC Day when the Federal Reserve meets to determine interest rates going forward. I don't think that anyone expects a rate hike but rather a rate cut. As always time will tell how that all works out.
Author

Nick Mastrandrea
Market Tea Leaves


