FOMC Day [Video]
![FOMC Day [Video]](https://editorial.fxstreet.com/images/Macroeconomics/CentralBanks/FED/front-elevation-of-the-fed-5405322_XtraLarge.jpg)
US Dollar: Sept USD is Down at 97.135.
Energies: July '19 Crude is Up at 54.37.
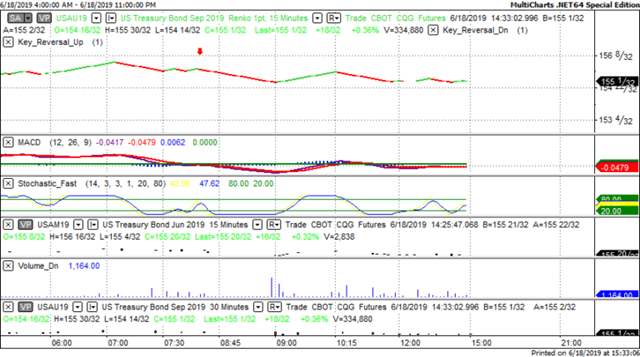
Financials: The Sept 30 year bond is Down 4 ticks and trading at 154.28.
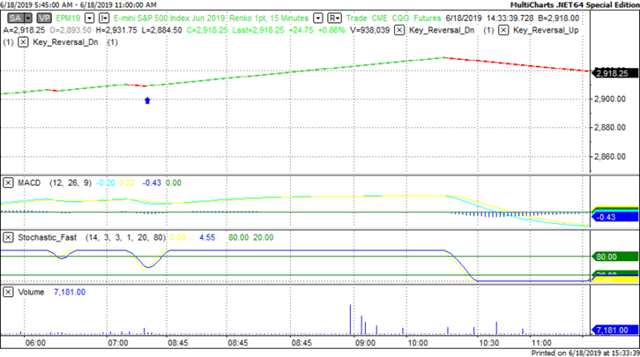
Indices: The June S&P 500 emini ES contract is 2 ticks Higher and trading at 2926.75.
Gold: The June Gold contract is trading Down at 1347.00. Gold is 37 ticks Lower than its close.
Initial Conclusion
This is not a correlated market. The dollar is Down- and Crude is Up+ which is normal and the 30 year Bond is trading Lower. The Financials should always correlate with the US dollar such that if the dollar is lower then bonds should follow and vice-versa. The S&P is Higher and Crude is trading Higher which is not correlated. Gold is trading Lower which is not correlated with the US dollar trading Down. I tend to believe that Gold has an inverse relationship with the US Dollar as when the US Dollar is down, Gold tends to rise in value and vice-versa. Think of it as a seesaw, when one is up the other should be down. I point this out to you to make you aware that when we don't have a correlated market, it means something is wrong. As traders you need to be aware of this and proceed with your eyes wide open.
All of Asia traded Higher at this time. Conversely all of Europe is trading Lower.
Possible Challenges To Traders Today
-
Crude Oil Inventories is out at 10:30 AM EST. This is major.
-
FOMC Economic Projections is out at 2 PM EST. This is major.
-
FOMC Statement is out at 2 PM EST. This is major.
-
Federal Funds Rate is out at 2 PM EST. This is major.
-
FOMC Press Conference starts at 2:30 PM EST. This is major.
Treasuries
We've elected to switch gears a bit and show correlation between the 30 year bond (ZB) and The YM futures contract. The YM contract is the DJIA and the purpose is to show reverse correlation between the two instruments. Remember it's liken to a seesaw, when up goes up the other should go down and vice versa.
Yesterday the ZB made a major move at around 8:15 AM EST. The ZB hit a High at around that time and the YM hit a Low. If you look at the charts below ZB gave a signal at around 8:15 AM EST and the YM was moving Higher at the same time. Look at the charts below and you'll see a pattern for both assets. ZB hit a High at around 8:15 AM and the YM was moving Higher at the same time. These charts represent the newest version of MultiCharts and I've changed the timeframe to a 15 minute chart to display better. This represented a Shorting opportunity on the 30 year bond, as a trader you could have netted about a dozen ticks per contract on this trade. Each tick is worth $31.25. Please note: the front month for the ZB contract is now September, 2019 and I've changed the format to Renko bars such that it may be more apparent and visible.
Charts Courtesy of MultiCharts built on an AMP platform.
Bias
Yesterday we gave the markets as we didn't see much in the way of correlation yesterday morning. The Dow gained 353 points and the other indices gained ground as well. Given that today is FOMC Day we will maintain a Neutral bias.
Could this change? Of Course. Remember anything can happen in a volatile market.
Commentary
It seems the markets have already baked in a rate cut as the Dow grew by over 350 points in yesterday's session and the other indices gained ground as well. The problem with all this speculation is that it's not based on anything other than innuendo. Will the Fed cut or not? To be quite frank with you I don't know what the Fed will do or not. There's arguments on both sides of the fence but the reality is that no ones knows what the Fed will do except the Fed and come 2 PM this afternoon we'll know as well....
Author

Nick Mastrandrea
Market Tea Leaves


