FOMC day

USD: Sept '25 is Down at 98.605.
Energies: Aug '25 Crude is Down at 68.62.
Financials: The Sep '25 30 Year T-Bond is Higher by 2 ticks and trading at 114.19.
Indices: The Sep '25 S&P 500 emini ES contract is 28 ticks Higher and trading at 6413.00.
Gold: The Aug'25 Gold contract is trading Up at 3384.70.
Initial conclusion
This is not a correlated market. The USD is Down and Crude is Down which is not normal, and the 30 Year T-Bond is trading Higher. The Financials should always correlate with the US dollar such that if the dollar is Higher, then the bonds should follow and vice-versa. The S&P is Higher and Crude is trading Lower which is correlated. Gold is trading Higher which is correlated with the US dollar trading Down. I tend to believe that Gold has an inverse relationship with the US Dollar as when the US Dollar is down, Gold tends to rise in value and vice-versa. Think of it as a seesaw, when one is up the other should be down. I point this out to you to make you aware that when we don't have a correlated market, it means something is wrong. As traders you need to be aware of this and proceed with your eyes wide open. Asia traded mainly Lower except Shanghai and Sensex. Currently all Europe is trading Higher.
Possible challenges to traders
-
ADP Non-Farm Employment Change is out at 8:15 AM EST. This is Major.
-
Advance GDP q/q is out at 8:30 AM EST. This is Major.
-
Advance GDP Price Index q/q out at 8:30 AM EST. This is Major.
-
Pending Home Sales m/m is out at 10 AM EST. This is Major.
-
Crude Oil Inventories is out at 10:30 AM EST. This is Major.
-
Federal Funds Rate is out at 2 PM EST. This is Major.
-
FOMC Statement is out at 2 PM EST. This is Major.
-
FOMC Press Conference Starts at 2:30 PM EST. This is Major.
Traders, please note that we've changed the Bond instrument from the 10 Year (ZN) to the 2 Year (ZT). They work exactly the same.
We've elected to switch gears a bit and show correlation between the 2-year Treasury notes (ZT) and the S&P futures contract. The YM contract is the Dow Jones Industrial Average, and the purpose is to show reverse correlation between the two instruments. Remember it's likened to a seesaw, when up goes up the other should go down and vice versa.
Yesterday the ZT climbed Higher at around 8:15 AM EST with no news pending. The Dow dived Lower at the same time. Look at the charts below and you'll see a pattern for both assets. The Dow dived Lower at 8:15 AM EST and the ZT climbed Higher at around the same time. These charts represent the newest version of Bar Charts, and I've changed the timeframe to a 15-minute chart to display better. This represented a Long opportunity on the 2-year note, as a trader you could have netted about a dozen plus ticks per contract on this trade. Each tick is worth $6.25. Please note: the front month for ZT is now Sep '25 and the Dow is now Sep '25. I've changed the format to filled Candlesticks (not hollow) such that it may be more apparent and visible.
Charts courtesy of BarCharts
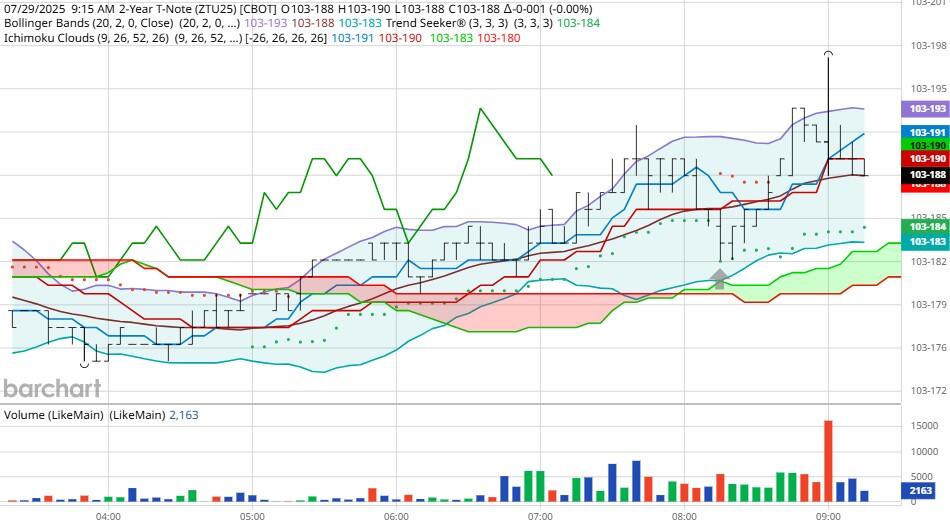
ZT -Sep 25 - 7/29/25
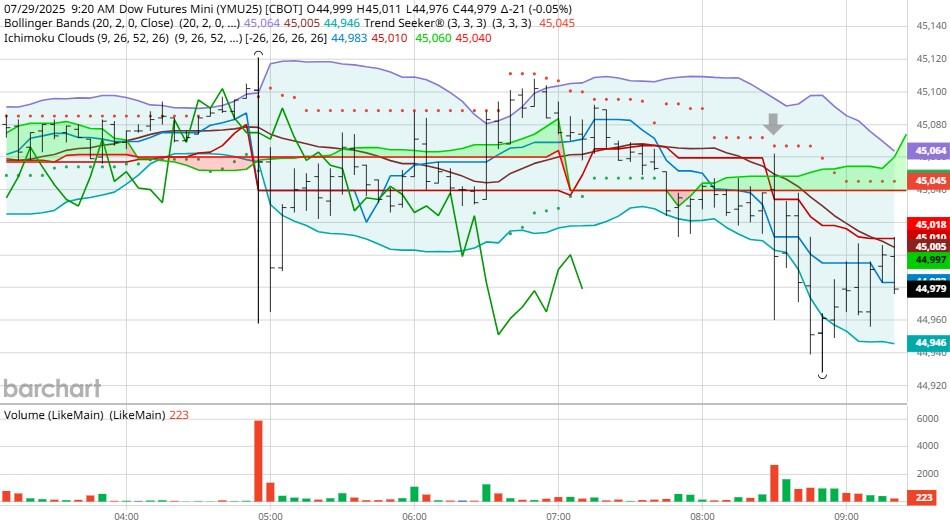
Dow - Sep 2025- 7/29/25
Bias
Yesterday we gave the markets a Neutral or Mixed bias and all the indices traded Lower despite the EU Trade/Tariff deal. The Dow dropped 205 points, and the other indices lost ground as well. Given that today is FOMC Day we will maintain our Neutral or Mixed bias as the markets have never shown any sense of normalcy on this day. Remember that a Neutral bias means the markets could go anywhere either high or low which is what happened yesterday.
Could this change? Of Course. Remember anything can happen in a volatile market.
Commentary
So, another FOMC Day and the question is will the Fed cut interest rates or not? Personally I don't think they will as they know their chief weapon is the ability to reduce rates when needed. In their mind they still need to analyze the markets and economics as they are prior to making that decision. Fed Chair Powell will not be bullied by Trump or anyone else when it comes to rate reduction. Whereas I would like them to start reducing, I don't think that will happen today. Want to learn Market Correlation and determine market direction hours before the Opening Bell?
Author

Nick Mastrandrea
Market Tea Leaves


