FOMC day

USD: Dec '24 is Down at 104.655.
Energies: Dec '24 Crude is Down at 70.93.
Financials: The Dec '24 30 Year T-Bond is Down 6 ticks and trading at 116.02.
Indices: The Dec '24 S&P 500 emini ES contract is 44 ticks Higher and trading at 5969.25.
Gold: The Dec'24 Gold contract is trading Up at 2677.30.
Initial conclusion
This is not a correlated market. The USD is Down and Crude is Down which is not normal, and the 30 Year T-Bond is trading Lower. The Financials should always correlate with the US dollar such that if the dollar is Higher, then the bonds should follow and vice-versa. The S&P is Higher and Crude is trading Lower which is correlated. Gold is trading Higher which is correlated with the US dollar trading Down. I tend to believe that Gold has an inverse relationship with the US Dollar as when the US Dollar is down, Gold tends to rise in value and vice-versa. Think of it as a seesaw, when one is up the other should be down. I point this out to you to make you aware that when we don't have a correlated market, it means something is wrong. As traders you need to be aware of this and proceed with your eyes wide open. Asia traded Mixed. All of Europe is trading mainly Higher except the London exchange.
Possible challenges to traders
-
Unemployment Claims is out at 8:30 AM EST. This is Major.
-
Prelim Nonfarm Productivity q/q is out at 8:30 AM EST. This is Major.
-
Prelim Unit Labor Costs q/q is out at 8:30 AM EST. This is Major.
-
Final Wholesale Inventories m/m is out at 10 AM EST. This is Major.
-
Mortgage Delinquencies - tentative. This is Major.
-
Natural Gas Storage is out at 10:30 AM EST. This is Major.
-
Federal Funds Rate is out at 2 PM EST. This is Major.
-
FOMC Statement is out at 2 PM EST. This is Major.
-
FOMC Press Conference starts at 2:30 PM EST. This is Major.
-
Consumer Credit m/m is out at 3 PM EST. This is Major.
Traders, please note that we've changed the Bond instrument from the 10 year (ZN) to the 2 year (ZT). They work exactly the same.
We've elected to switch gears a bit and show correlation between the 2-year Treasury notes (ZT) and the S&P futures contract. The YM contract is the Dow Jones Industrial Average, and the purpose is to show reverse correlation between the two instruments. Remember it's likened to a seesaw, when up goes up the other should go down and vice versa.
Yesterday the ZT leapt Higher at around 7:30 AM EST as the election results were reported. The Dow dived Lower at the same time. Look at the charts below and you'll see a pattern for both assets. The Dow moved Lower at 7:30 AM and the ZT moved Higher at around the same time. These charts represent the newest version of Bar Charts, and I've changed the timeframe to a 15-minute chart to display better. This represented a Long opportunity on the 2-year note, as a trader you could have netted about 20 plus ticks per contract on this trade. Each tick is worth $7.625. Please note: the front month for ZT is Dec and the Dow is now Dec '24. I've changed the format to filled Candlesticks (not hollow) such that it may be more apparent and visible.
Charts courtesy of barcharts
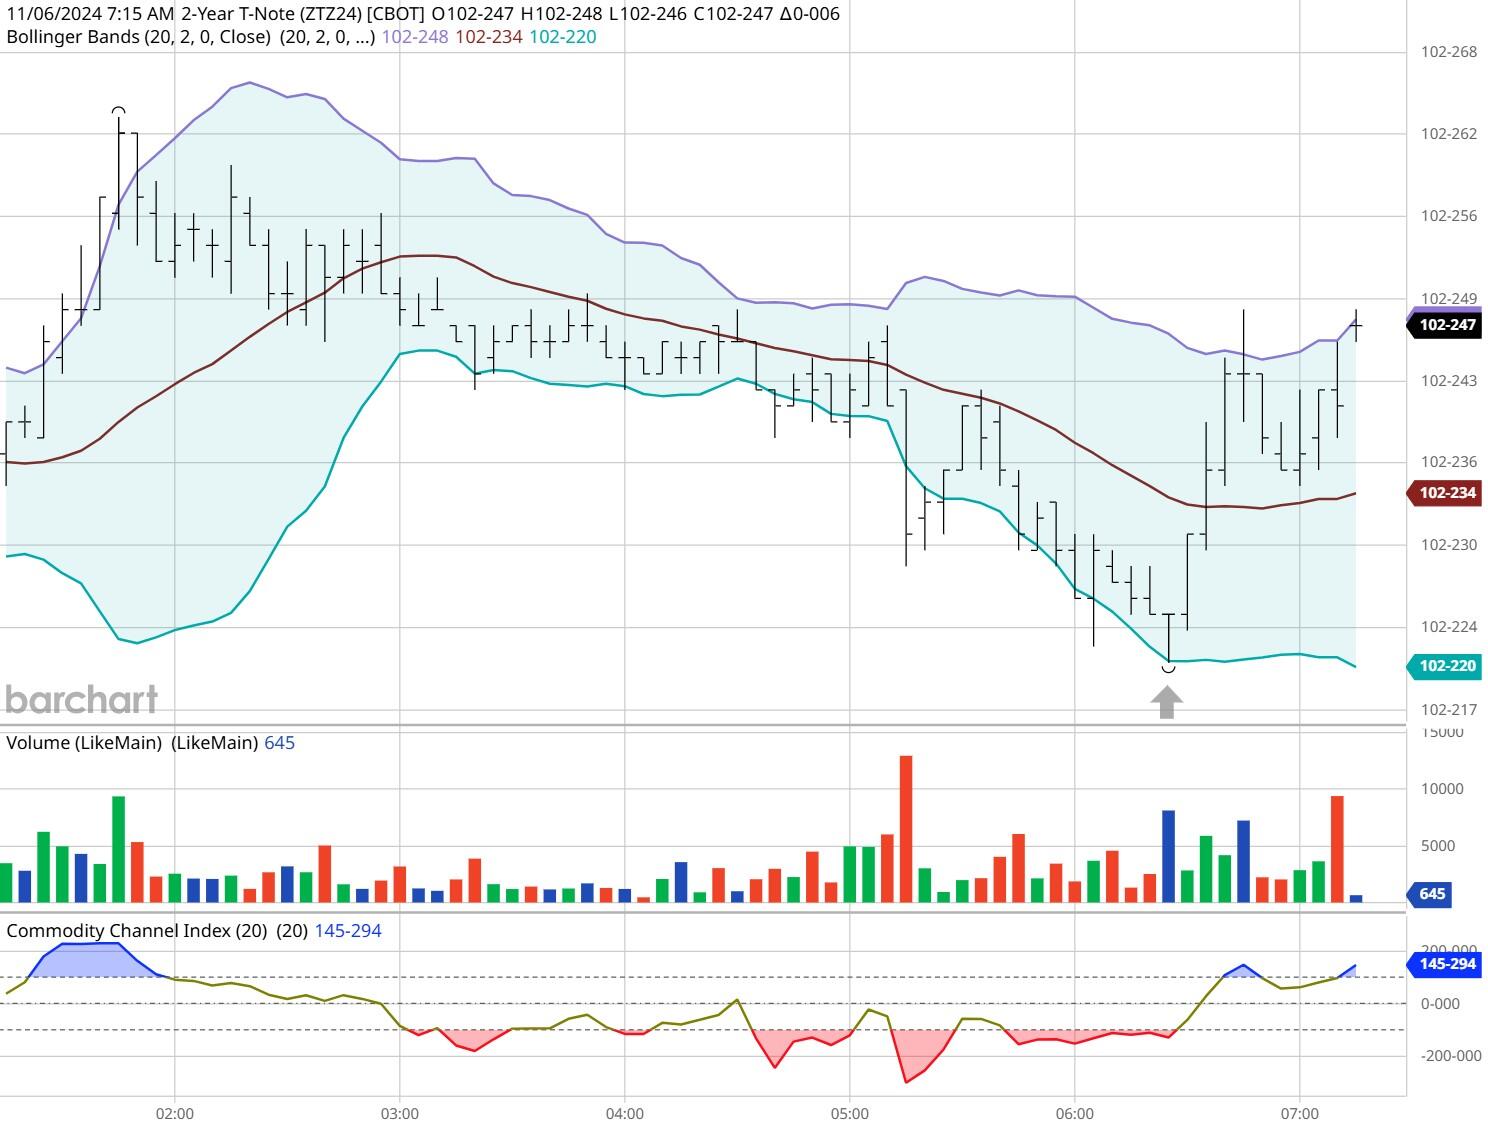
ZT -Dec 2024 - 11/06/24
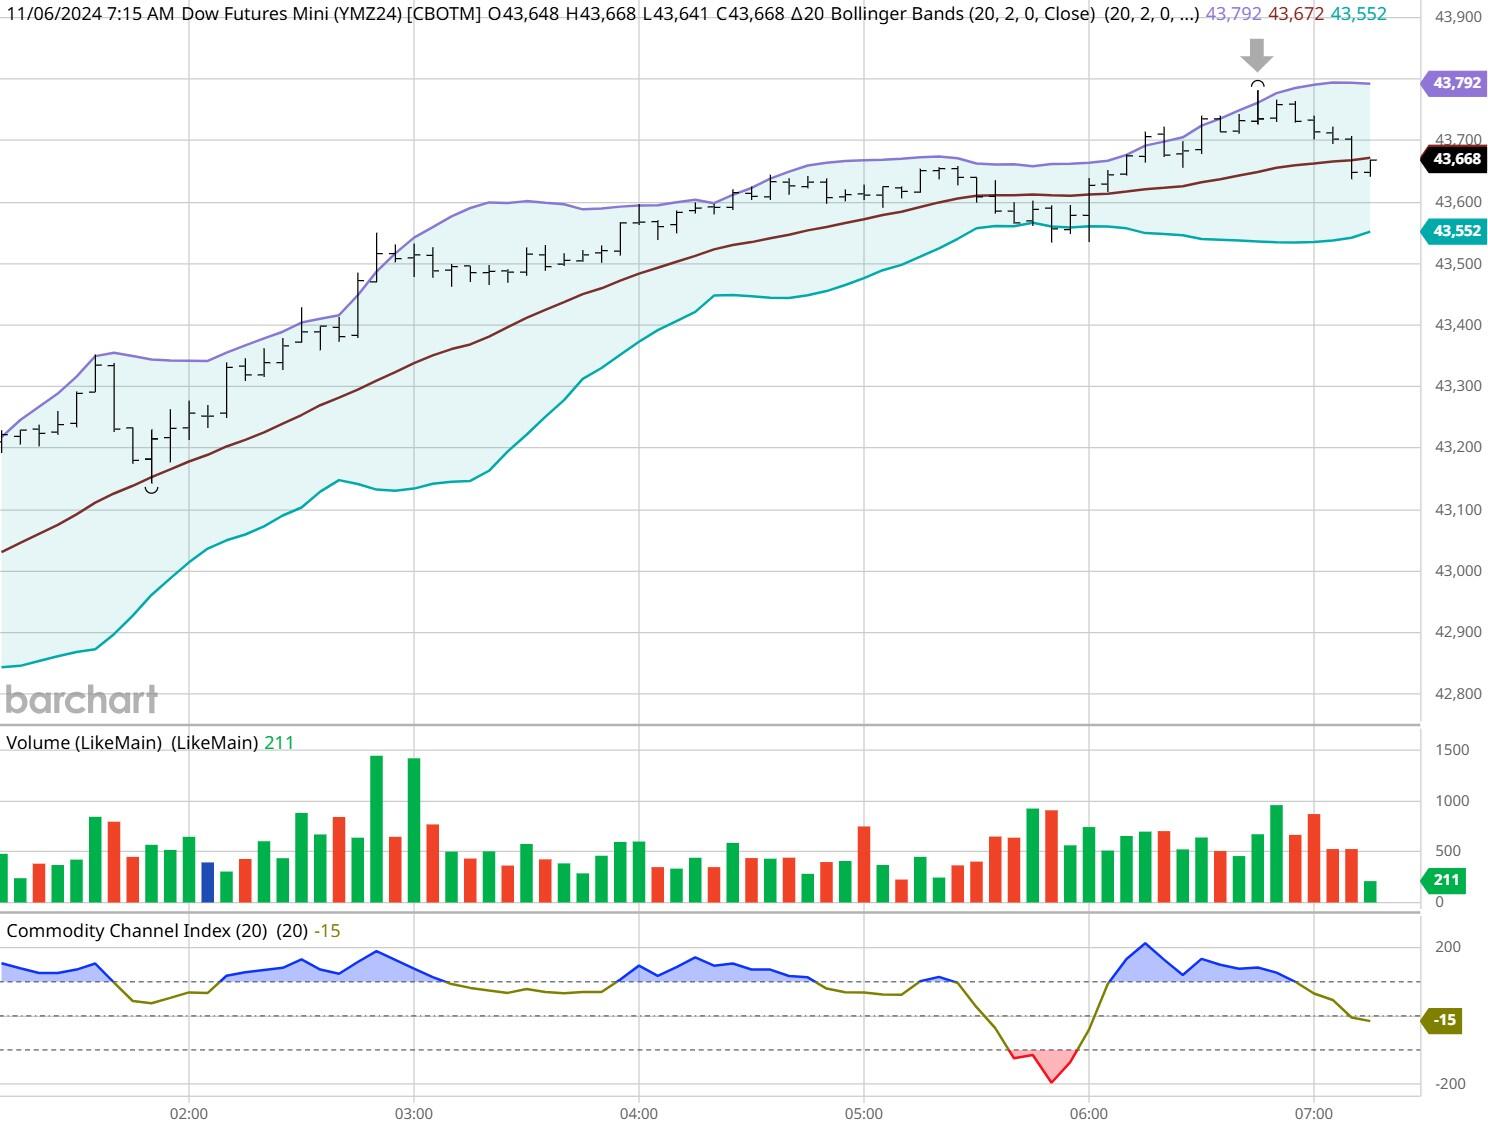
Dow - Dec 2024- 11/06/24
Bias
Yesterday we gave the markets an Upside bias and the markets didn't disappoint. The Dow leapt Higher by over 1500 points and the other indices gained ground as well. Given that today is FOMC Day our bias is Neutral or Mixed.
Could this change? Of Course. Remember anything can happen in a volatile market.
Commentary
Oh well, it's final. President Trump is now President-elect Trump once again. Trump gained 291 electoral votes versus Harris' 224. Upon realizing this the markets went wild yesterday. The Dow alone gained 1,508 points and the other indices skyrocketed as well. While all this elation is good, the question is will this hold or is it temporary? Today we have the FOMC meeting which will determine if the Federal Reserve will lower rates or stand pat. I am hoping this being this close to the Holiday spending season, the Federal Reserve will lower but as in all things, only time will tell.
Author

Nick Mastrandrea
Market Tea Leaves
Nick Mastrandrea over 20 years experience in trading and formerly held a NASD Series 7. He currently holds a NJ Life, Health and Variable Authority. Nick is a published writer and his work has appeared in Futures Magazine, TraderPlanet and others.


