US UoM Consumer Sentiment Index dips to 51 in August
- Consumer confidence is expected to cool further in August.
- One-year inflation expectations picked up pace to 4.3%.

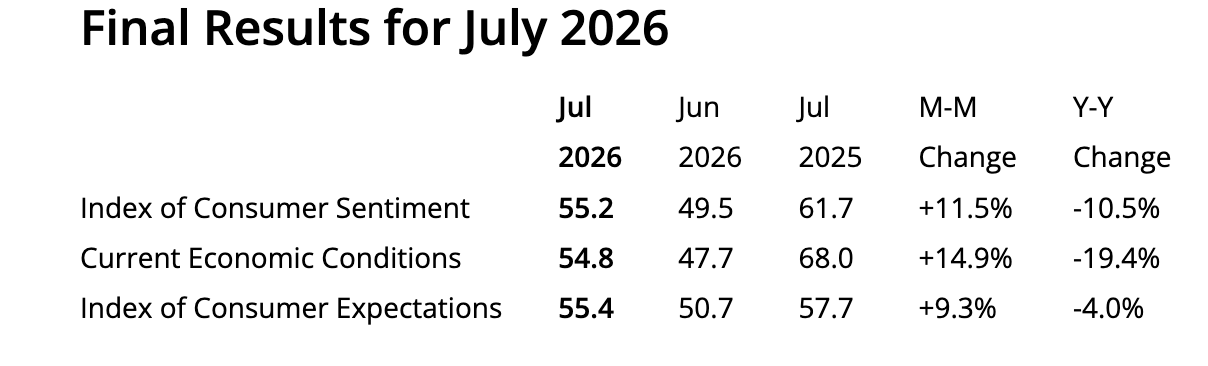
The preliminary University of Michigan Consumer Sentiment Index dipped in August to 51 from 55.2 in the previous month, missing economists’ expectations (54.5) and signalling extra weaknening in public confidence.
American consumer confidence is expected to lose some traction in August, as households have been growing more pessimistic about current conditions and the broader economic outlook, according to the University of Michigan (UoM) report on Friday.
Furthermore, the Current Conditions index edged lower to 51.8 from 54.8, while the Expectations gauge followed suit, down to 50.6 from 55.4, highlighting a downbeat scenario for the months ahead.
Inflation expectations, meanwhile, appear to have reignited somewhat: the one-year outlook rose to 4.3% (from 4.2%), and the five-year forecast held steady at 3.3%.
Market reaction
The US Dollar remains well offered, flirting with the area of weekly troughs and sending the US Dollar Index (DXY) back to the mid-99.00s.
US Dollar Price Today
The table below shows the percentage change of US Dollar (USD) against listed major currencies today. US Dollar was the strongest against the Japanese Yen.
| USD | EUR | GBP | JPY | CAD | AUD | NZD | CHF | |
|---|---|---|---|---|---|---|---|---|
| USD | -0.43% | -0.48% | -0.32% | -0.45% | -0.43% | -0.72% | -0.37% | |
| EUR | 0.43% | -0.06% | 0.11% | -0.07% | 0.00% | -0.30% | 0.05% | |
| GBP | 0.48% | 0.06% | 0.19% | -0.00% | 0.06% | -0.22% | 0.11% | |
| JPY | 0.32% | -0.11% | -0.19% | -0.13% | -0.11% | -0.43% | -0.05% | |
| CAD | 0.45% | 0.07% | 0.00% | 0.13% | 0.02% | -0.27% | 0.08% | |
| AUD | 0.43% | -0.01% | -0.06% | 0.11% | -0.02% | -0.30% | 0.05% | |
| NZD | 0.72% | 0.30% | 0.22% | 0.43% | 0.27% | 0.30% | 0.36% | |
| CHF | 0.37% | -0.05% | -0.11% | 0.05% | -0.08% | -0.05% | -0.36% |
The heat map shows percentage changes of major currencies against each other. The base currency is picked from the left column, while the quote currency is picked from the top row. For example, if you pick the US Dollar from the left column and move along the horizontal line to the Japanese Yen, the percentage change displayed in the box will represent USD (base)/JPY (quote).
This section below was published as a preview of the preliminary print of the University of Michigan Consumer Sentiment for August at 13:00 GMT.
- The Preliminary Michigan Consumer Sentiment Index is expected to ease to 54.5 from 55.2 in July
- US consumers’ optimism has improved to levels close to those seen before the US-Iran war began.
- August’s UoM Consumer Sentiment is unlikely to change the view on the Fed’s monetary policy, which is the main USD driver.
The University of Michigan (UoM) will release the preliminary estimate of August’s Consumer Sentiment Index on Friday. The UoM report, which analyses US consumers’ feelings about their personal finances, business conditions, and purchasing plans, is expected to show a moderate decline, yet remain relatively close to levels in January and February, when concerns about Iran’s war and the economic impact of the energy shock were absent.
US consumers’ confidence is expected to have ticked down to 54.5 in August from 55.2 in July, as measured by the UoM Consumer Sentiment Index. These numbers would highlight fairly resilient sentiment in the face of uncertainty surrounding the Middle East conflict, a deteriorating labour market, and stubbornly high price pressure.
The risk on the US Dollar (USD) is skewed to the downside. A positive surprise on August’s Michigan Consumer Sentiment Index is unlikely to change the prevailing view that the Federal Reserve (Fed) will stand pat on rates in September, while a weak sentiment report might heighten doubts about the momentum of the US economy, pushing Fed rate hikes further back and adding pressure on the Greenback.
What to expect from August’s UoM Consumer Sentiment Index report?
Investors will be attentive to Friday’s data to see how US consumers are responding to the Middle East deadlock and the persistently high prices.
US macroeconomic data released earlier this week revealed some moderation in inflation, yet the headline Consumer Price Index (CPI) is growing at a 3.4% YoY rate in July, a whole percentage point above the levels seen in January and February, before the Middle East conflict sent Oil prices surging.
If this was not enough, the Nonfarm Payrolls (NFP) report showed that net employment contracted unexpectedly in July, highlighting a sharp deterioration of the labour market, which sooner or later is highly likely to dent consumers’ confidence.
July’s University of Michigan report highlighted a broad-based improvement, although looking from a wider perspective, the overall sentiment remains well below its historical average. The Director of the Survey of Consumers, Johanne Hsu, noted that “sentiment is 11% below a year ago, reflecting a generally somber view of the economy amid five years of elevated inflation and persistently high prices.”
Bearing this in mind, the landscape has not given reasons to contemplate a positive surprise on Friday. Quite the contrary. West Texas Intermediate (WTI) Oil prices are more than 15% above the levels in early July, when the interviews for last month’s report took place, and the situation in the Middle East remains stalled, pushing energy prices and overall inflation higher.
Inflation expectations for the year ahead eased in July to 4.2% from 4.6% in June, but recent developments might have prompted some recovery in August, adding pressure to the overall sentiment.
When will the UoM Consumer Sentiment Index be released, and how could it affect the US Dollar?
The University of Michigan will release its Consumer Sentiment Index, together with the Consumer Inflation Expectations survey, on Friday at 14:00 GMT. The market consensus hints at a moderate pullback from July’s reading, although showing levels not far from the 2026 peak.
The US Dollar remains weighed down by dwindling hopes of Fed rate hikes, although the cautious market mood amid growing uncertainty about the fate of the US-Iran peace process has kept the safe-haven Greenback buoyed this week.
The USD Index (DXY), which measures the value of the US Dollar against a basket of six major currency peers, has been showing a mild upside bias over the last few days, after finding some support at the 99.45 area. Bulls, however, have been unable to find acceptance above the 100.00 psychological level at the time of writing.
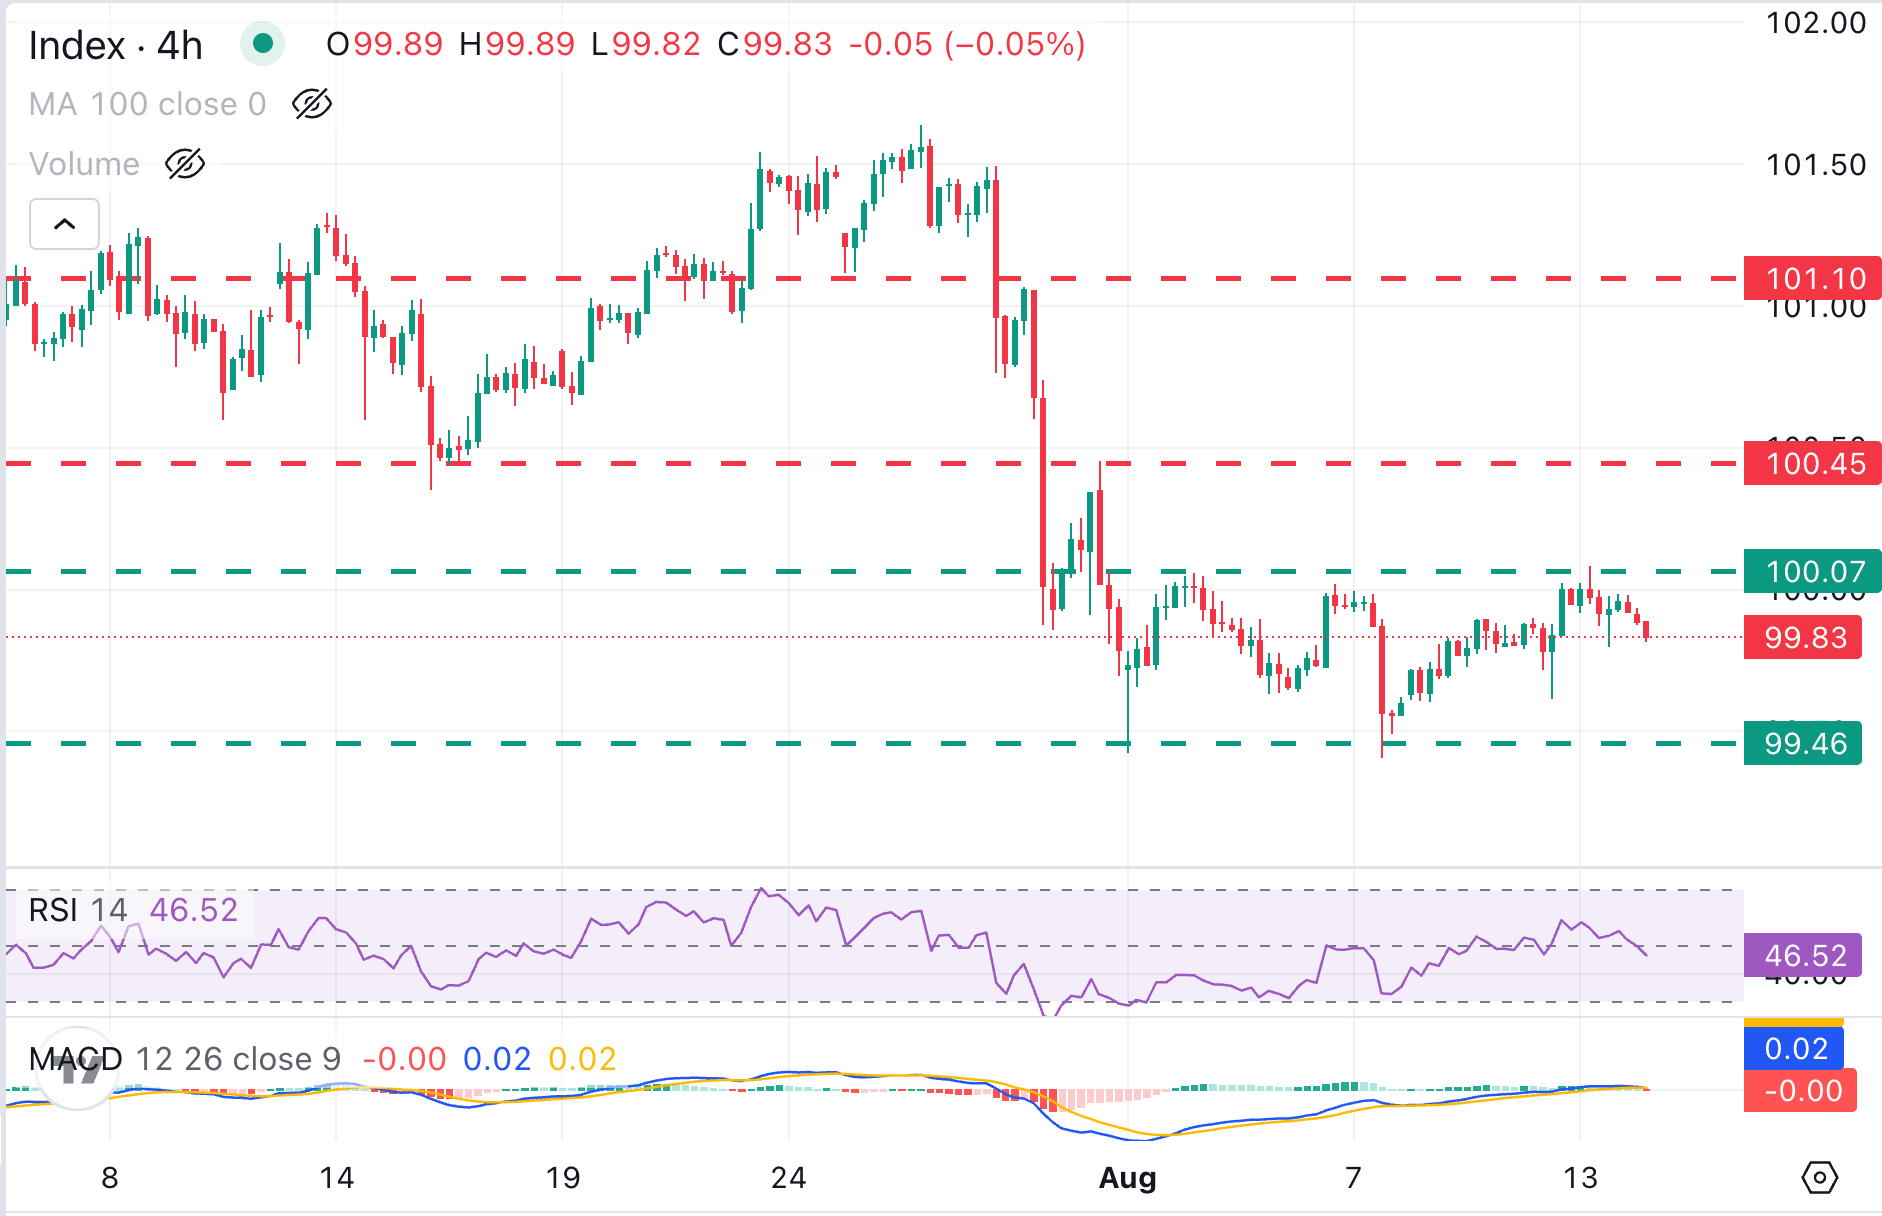
The 4-hour chart highlights a neutral-to-bearish near-term bias, with the Relative Strength Index (RSI 14) drifting below the 50 midline and the Moving Average Convergence Divergence (MACD) histogram marginally in negative territory. This hints at a fading bullish undertone rather than a bearish reversal.
Bulls would need a clear break of the 100.00 resistance zone to shift the focus towards a previous support area near 100.45, which capped bulls on July 31, ahead of the July 30 high, a few pips above 101.00. On the downside, Wednesday’s low in the 99.60 region is likely to test bears’ confidence, although the key support area is the mentioned 99.40, the bottom of the last two months’ trading range.
Economic Indicator
Michigan Consumer Sentiment Index
The Michigan Consumer Sentiment Index, released on a monthly basis by the University of Michigan, is a survey gauging sentiment among consumers in the United States. The questions cover three broad areas: personal finances, business conditions and buying conditions. The data shows a picture of whether or not consumers are willing to spend money, a key factor as consumer spending is a major driver of the US economy. The University of Michigan survey has proven to be an accurate indicator of the future course of the US economy. The survey publishes a preliminary, mid-month reading and a final print at the end of the month. Generally, a high reading is bullish for the US Dollar (USD), while a low reading is bearish.
Read more.Next release: Fri Aug 14, 2026 14:00 (Prel)
Frequency: Monthly
Consensus: 54.5
Previous: 55.2
Source: University of Michigan
Consumer exuberance can translate into greater spending and faster economic growth, implying a stronger labor market and a potential pick-up in inflation, helping turn the Fed hawkish. This survey’s popularity among analysts (mentioned more frequently than CB Consumer Confidence) is justified because the data here includes interviews conducted up to a day or two before the official release, making it a timely measure of consumer mood, but foremost because it gauges consumer attitudes on financial and income situations. Actual figures beating consensus tend to be USD bullish.
Economic Indicator
UoM 1-year Consumer Inflation Expectations
The University of Michigan's Inflation Expectations gauge captures how much consumers anticipate prices will change over the coming 12 months. It comes out in two rounds—a preliminary release that tends to pack a bigger punch, followed by a revised update two weeks later.
Read more.Next release: Fri Aug 14, 2026 14:00 (Prel)
Frequency: Monthly
Consensus: -
Previous: 4.2%
Source: University of Michigan
Author

FXStreet Team
FXStreet
Composed of a group of economic journalists and FX experts, the FXStreet content team produces and oversees all content published on FXStreet. It provides a purely journalistic approach to the Forex market.
















