FOMC Day

Good Morning Traders,
As of this writing 4 AM EST, here’s what we see:
US Dollar: March. USD is Down at 96.275.
Energies: Feb '19 Crude is Up at 46.79.
Financials: The Mar 30 year bond is Up 5 ticks and trading at 144.01.
Indices: The Dec S&P 500 emini ES contract is 56 ticks Higher and trading at 2552.00.
Gold: The Feb Gold contract is trading Up at 1254.50. Gold is 9 ticks Higher than its close.
Initial Conclusion
This is not a correlated market. The dollar is Down- and Crude is Up+ which is normal but the 30 year Bond is trading Higher. The Financials should always correlate with the US dollar such that if the dollar is lower then bonds should follow and vice-versa. The S&P is Higher and Crude is trading Higher which is not correlated. Gold is trading Up+ which is correlated with the US dollar trading Lower. I tend to believe that Gold has an inverse relationship with the US Dollar as when the US Dollar is down, Gold tends to rise in value and vice-versa. Think of it as a seesaw, when one is up the other should be down. I point this out to you to make you aware that when we don't have a correlated market, it means something is wrong. As traders you need to be aware of this and proceed with your eyes wide open.
At this hour Asia is trading mainly Higher with the exception of the Nikkei and Shanghai exchanges which are Lower at this time. Currently all of Europe is trading to the Upside.
Possible Challenges To Traders Today
-
Current Account is out at 8:30 AM EST. This is major.
-
Existing Home Sales is out at 10 AM EST. This is major.
-
Crude Oil Inventories is out at 10:30 AM EST. This is major.
-
FOMC Economic Projections is out at 2 PM EST. This is major.
-
FOMC Statement is out at 2 PM EST. This is major.
-
Federal Funds Rate is out at 2 PM EST. This is major.
-
FOMC Press Conference starts at 2:30 PM EST. Major.
Treasuries
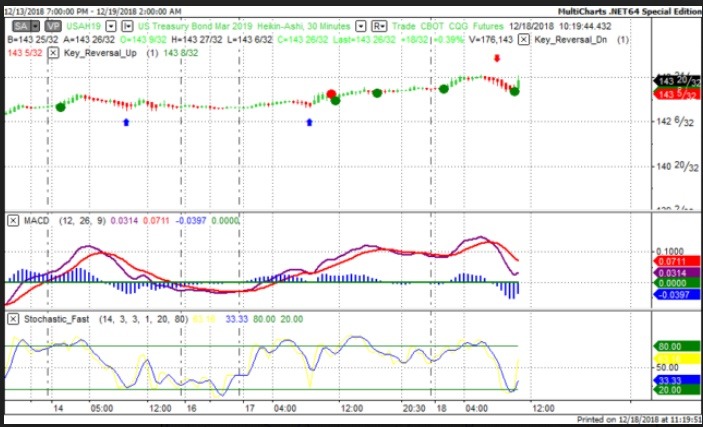
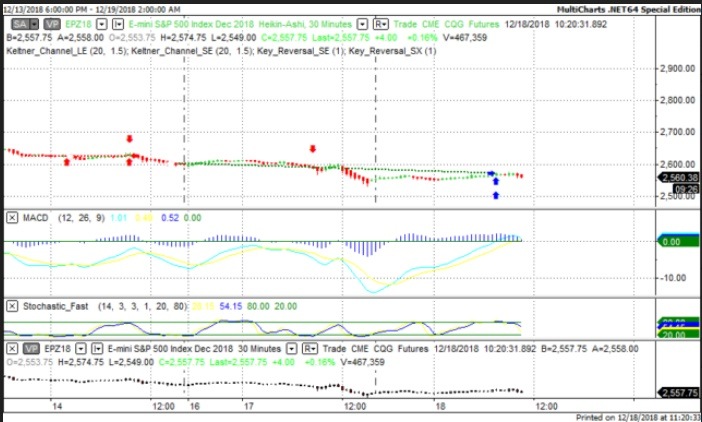
We've elected to switch gears a bit and show correlation between the 30 year bond (ZB) and The YM futures contract. The YM contract is the DJIA and the purpose is to show reverse correlation between the two instruments. Remember it's liken to a seesaw, when up goes up the other should go down and vice versa.
Yesterday the ZB made it's move at around 8 AM EST. The ZB hit a High at around that time and the YM hit a Low. If you look at the charts below ZB gave a signal at around 8 AM EST and the YM was moving Higher at the same time. Look at the charts below and you'll see a pattern for both assets. ZB hit a High at around 8 AM and the YM was moving Higher at the same time. These charts represent the newest version of MultiCharts and I've changed the timeframe to a 30 minute chart to display better. This represented a Long opportunity on the 30 year bond, as a trader you could have netted about 15 ticks per contract on this trade. Each tick is worth $31.25. Please note: the front month for the ZB contract is now March, 2019
Charts Courtesy of MultiCharts built on an AMP platform.
Bias
Yesterday gave the markets a Neutral bias as the Bonds were trading Higher yesterday morning while the S&P was also trading Higher which did not show any correlation. The eco news came out and the markets made up its mind to go Higher. The Dow gained 83 points and the other indices gained ground as well. Given that today is FOMC Day our bias is Neutral.
Could this change? Of Course. Remember anything can happen in a volatile market.
Commentary
Today we discover if whether or not the Fed wants to propel the markets forward or remain in a stalemate position which is where it's been this month. This is the Holiday Season and as such the biggest shopping time of the year. The best way to clamp down on consumer spending is to hike interest rates. Do we think the Fed will hike? Honestly I don't know. There will be a press conference scheduled at 2:30 PM and that's usually an indication that they will indeed hike. However recently it appears that the Fed is taking a neutral stance in this regard, so time will tell....
Author

Nick Mastrandrea
Market Tea Leaves


