FOMC Day

Good Morning Traders,
As of this writing 4:30 AM EST, here’s what we see:
US Dollar: Dec. USD is Up at 95.900.
Energies: Dec '18 Crude is Up at 62.30.
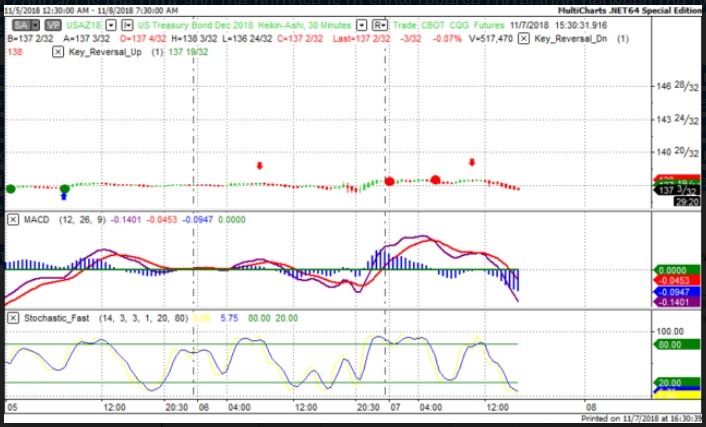
Financials: The Dec 30 year bond is Down 5 ticks and trading at 137.07.
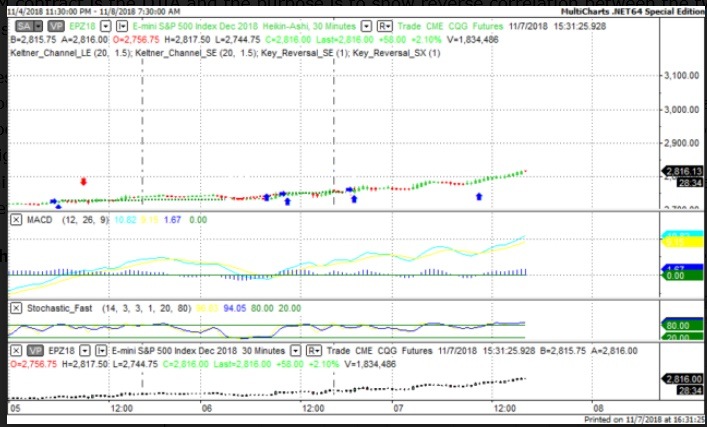
Indices: The Dec S&P 500 emini ES contract is 14 ticks Lower and trading at 2813.00.
Gold: The Dec Gold contract is trading Down at 1223.70. Gold is 50 ticks Lower than its close.
Initial Conclusion
This is not a correlated market. The dollar is Up+ and Crude is Up+ which is not normal but the 30 year Bond is trading Lower. The Financials should always correlate with the US dollar such that if the dollar is lower then bonds should follow and vice-versa. The S&P is Lower and Crude is trading Higher which is correlated. Gold is trading Down- which is correlated with the US dollar trading Higher. I tend to believe that Gold has an inverse relationship with the US Dollar as when the US Dollar is down, Gold tends to rise in value and vice-versa. Think of it as a seesaw, when one is up the other should be down. I point this out to you to make you aware that when we don't have a correlated market, it means something is wrong. As traders you need to be aware of this and proceed with your eyes wide open.
At this hour Asia is trading mainly Higher with the exception of the Shanghai exchange. Currently all of Europe is trading Higher.
Possible Challenges To Traders Today
-
Unemployment Claims is out at 8:30 AM EST. This is major.
-
Natural Gas Storage is out at 10:30 AM EST. This is major.
-
FOMC Statement is out at 2 PM EST. This is major.
-
Federal Funds Rate is out at 2 PM EST. This is major.
Treasuries
We've elected to switch gears a bit and show correlation between the 30 year bond (ZB) and The YM futures contract. The YM contract is the DJIA and the purpose is to show reverse correlation between the two instruments. Remember it's liken to a seesaw, when up goes up the other should go down and vice versa.
Yesterday the ZB made it's move at around 10:30 AM EST. The ZB hit a High at around that time and the YM hit a Low. If you look at the charts below ZB gave a signal at around 10:30 AM EST and the YM was moving Higher at the same time. Look at the charts below and you'll see a pattern for both assets. ZB hit a High at around 10:30 AM and the YM was moving Higher at the same time. These charts represent the newest version of MultiCharts and I've changed the timeframe to a 30 minute chart to display better. This represented a Shorting opportunity on the 30 year bond, as a trader you could have netted about 20 ticks per contract on this trade. Each tick is worth $31.25.
Charts Courtesy of MultiCharts built on an AMP platform.
Bias
Yesterday we gave the markets an Upside bias and the markets certainly didn't disappoint as the Dow gained a whopping 545 points and the other indices gained ground as well. Given that today is FOMC Day our bias is Neutral.
Could this change? Of Course. Remember anything can happen in a volatile market.
Commentary
It would appear as though Tuesday's election really did something for the markets as the Dow, S&P and Nasdaq all roared yesterday. We thought the markets would rise as the USD and Crude were all Lower and that is indicative of an Upside day; the markets didn't disappoint. Today is also FOMC Day however there is no 2:30 PM press conference scheduled hence we don't think the Fed will hike the Overnight or FFR rate.
Author

Nick Mastrandrea
Market Tea Leaves


