FOMC Day

Good Morning Traders,
As of this writing 4 AM EST, here’s what we see:
US Dollar: Jun. USD is Up at 93.885.
Energies: Jul '18 Crude is Down at 65.97.
Financials: The Sept 30 year bond is Down 1 tick and trading at 142.28.
Indices: The June S&P 500 emini ES contract is 7 ticks Higher and trading at 2790.00.
Gold: The June gold contract is trading Down at 1297.70. Gold is 17 ticks Lower than its close.
Initial Conclusion
This is not a correlated market. The dollar is Up+ and Crude is Down- which is normal but the 30 year Bond is trading Lower. The Financials should always correlate with the US dollar such that if the dollar is lower then bonds should follow and vice-versa. The S&P is Higher and Crude is trading Lower which is correlated. Gold is trading Down- which is correlated with the US dollar trading Up+. I tend to believe that Gold has an inverse relationship with the US Dollar as when the US Dollar is down, Gold tends to rise in value and vice-versa. Think of it as a seesaw, when one is up the other should be down. I point this out to you to make you aware that when we don't have a correlated market, it means something is wrong. As traders you need to be aware of this and proceed with your eyes wide open.
At this hour Asia is trading mainly Lower with the exception of the Nikkei and Indian Sensex exchanges which are Higher. Currently all of Europe is trading Lower with the exception of the Milan exchange which is lower at this time.
Possible Challenges To Traders Today
-
PPI is out at 8:30 AM EST. This is major.
-
Core PPI m/m is out at 8:30 AM EST. This is major.
-
Crude Oil Inventory is out at 10:30 AM EST. This is major.
-
FOMC Economic Projections is out at 2 PM EST. This is major.
-
FOMC Statement is out at 2 PM EST. This is major.
-
Federal Funds Rate is out at 2 PM EST. This is major.
-
FOMC Press Conference starts at 2:30 PM EST. This is major.
Treasuries
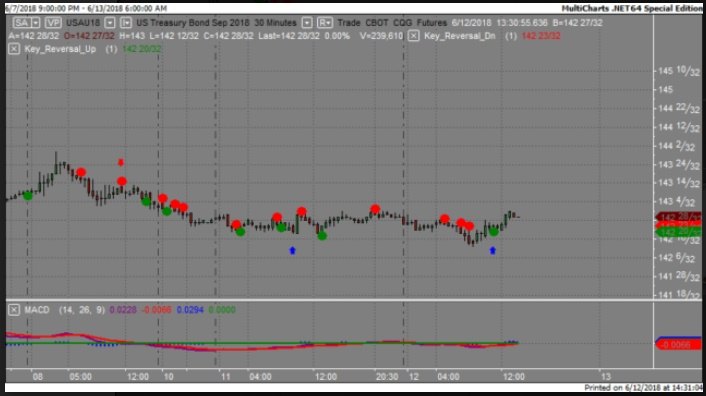
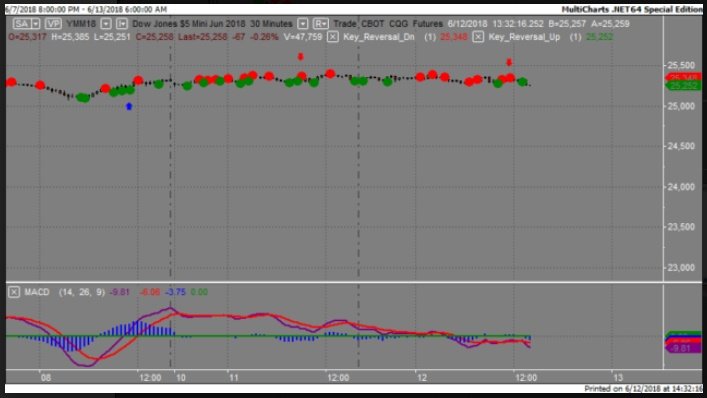
We've elected to switch gears a bit and show correlation between the 30 year bond (ZB) and The YM futures contract. The YM contract is the DJIA and the purpose is to show reverse correlation between the two instruments. Remember it's liken to a seesaw, when up goes up the other should go down and vice versa.
Yesterday the ZB made it's move at around 11 AM EST. The ZB hit a Low at around that time and the YM hit a High. If you look at the charts below ZB gave a signal at around 11 AM EST and the YM was moving Lower at the same time. Look at the charts below and you'll see a pattern for both assets. ZB hit a Low at around 11 AM and the YM was trending Lower at the same time. These charts represent the newest version of MultiCharts and I've changed the timeframe to a 30 minute chart to display better. This represented a long opportunity on the 30 year bond, as a trader you could have netted about a dozen ticks per contract on this trade. Each tick is worth $31.25.
Charts Courtesy of MultiCharts built on an AMP platform.
Bias
Yesterday we gave the markets an Upside bias as the USD, Bonds and Gold were all trading Lower Tuesday morning and this is usually an indication for an Upside day. The Dow closed down fractionally (by 2 points) but the other indices gained on the day. Given that today is FOMC Day we will maintain a Neutral bias for the day.
Could this change? Of Course. Remember anything can happen in a volatile market.
Commentary
Yesterday morning the markets were poised to go higher as the initial news from Singapore suggested a positive accord between North Korea and the US. This however was dwarfed by the news that the de-nuclearzation of the Korean peninsula was taken off the table and markets didn't care for that news as the Dow dropped late in the afternoon. Today we have the FOMC Meeting and as such will maintain a neutral bias. Do we think the Federal Reserve will hike the overnight rate? Unfortunately yes.
Author

Nick Mastrandrea
Market Tea Leaves


