FOMC Day

Good Morning Traders,
As of this writing 4 AM EST, here’s what we see:
US Dollar: Dec. USD is Down at 91.550.
Energies: Nov Crude is Up at 50.34.
Financials: The Dec 30 year bond is Up 2 ticks and trading at 154.06.
Indices: The Dec S&P 500 emini ES contract is 1 tick Lower and trading at 2504.50.
Gold: The Dec gold contract is trading Up at 1316.10. Gold is 55 ticks Higher than its close.
Initial Conclusion
This is not a correlated market. The dollar is Down- and Crude is Up+ which is normal but the 30 year Bond is trading Higher. The Financials should always correlate with the US dollar such that if the dollar is lower then bonds should follow and vice-versa. The indices are Mixed and Crude is trading Up+ which is not correlated. Gold is trading Up+ which is correlated with the US dollar trading Down-. I tend to believe that Gold has an inverse relationship with the US Dollar as when the US Dollar is down, Gold tends to rise in value and vice-versa. Think of it as a seesaw, when one is up the other should be down. I point this out to you to make you aware that when we don’t have a correlated market, it means something is wrong. As traders you need to be aware of this and proceed with your eyes wide open.
At this hour all of Asia is trading Mixed with half the exchanges Higher and the other half Lower. As of this writing Europe is also trading Mixed.
Possible Challenges To Traders Today
Existing Home Sales are out at 10 AM EST. This is major.
Crude Oil Inventories is out at 10:30 AM. This is major.
FOMC Economic Projections is out at 2 PM. This is major.
FOMC Statement is out at 2 PM. This is major.
Federal Funds Rate is out at 2 PM EST. This is major.
FOMC Press Conference starts at 2:30 PM EST. This is major.
Treasuries
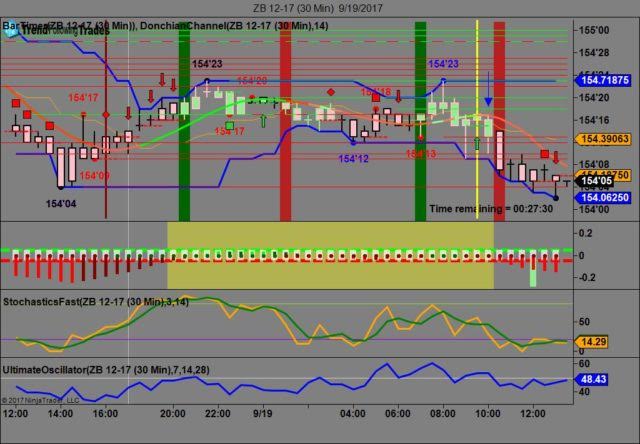
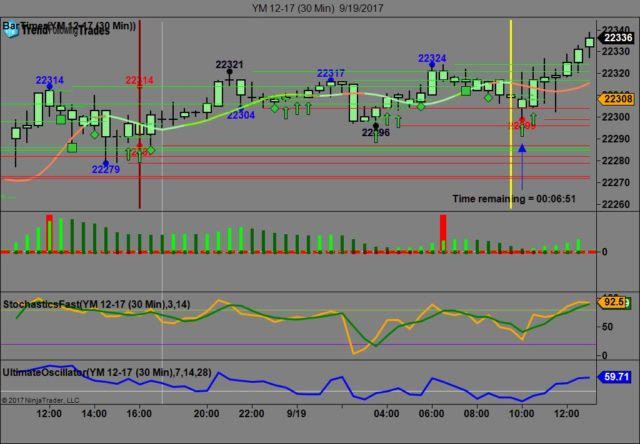
We’ve elected to switch gears a bit and show correlation between the 30 year bond (ZB) and The YM futures contract. The YM contract is the DJIA and the purpose is to show reverse correlation between the two instruments. Remember it’s liken to a seesaw, when up goes up the other should go down and vice versa.
Yesterday the ZB made it’s move at around 10 AM EST after all the economic news was reported. The ZB hit a High at around that time and the YM hit a Low. If you look at the charts below ZB gave a signal at around 10 AM EST and the YM was moving Higher at the same time. Look at the charts below and you’ll see a pattern for both assets. ZB hit a High at around 10 AM and the YM hit a Low. These charts represent the newest version of Trend Following Trades and I’ve changed the timeframe to a 30 minute chart to display better. This represented a shorting opportunity on the 30 year bond, as a trader you could have netted about 15 plus ticks per contract on this trade. Each tick is worth $31.25. We added a Donchian Channel to the charts to show the signals more clearly. Please note that the front month for the ZB and the YM contract is now December, 2017.
Charts Courtesy of Trend Following Trades built on a NinjaTrader platform.
Bias
Yesterday we called for a Neutral bias as the indices didn’t show any sense of direction yesterday morning. The Dow gained 39 points and the other indices gained ground as well. Given that today is FOMC Day we will maintain a Neutral bias as the markets have never shown any sense of normalcy on this day.
Could this change? Of Course. Remember anything can happen in a volatile market.
Commentary
Yesterday the economic news came in better than expected for both Building Permits and Housing Starts. Both of these reports are real estate based and that sector still has a strong hold on the US economy. The markets gained despite Trump’s threat to destroy North Korea. Today is FOMC Day and the big question is will the Fed hike? Truth be told we really don’t know. Our train of thought says they shouldn’t but that hasn’t stopped them before. All we can say is that hiking the FFR tends to slow consumer spending and that is vital to the US economy. 70% of the US economy is derived from consumer spending so anything that will impede it isn’t good. Will they raise? We’ll all find out at 2 PM EST.
Author

Nick Mastrandrea
Market Tea Leaves


