Focus turns once more on trade talks between US and China

Market Overview
The tone of risk appetite on major markets is likely to be set by any signals coming out of the latest round of trade talks between the US and China over the coming days. For now there is a marginal risk negative vibe, associated with the fact that President Trump does not see a meeting with President Xi before the 1st March deadline. This increases the prospect of tariffs being ramped up and the trade dispute escalating once more. A move into safe havens is subsequently underway. Bond yields are in retreat as equities and the oil price have been sliding. The US dollar is in favour, whilst the Japanese yen and gold are holding up relatively well in consolidation patterns. Unless any positive rhetoric comes from the trade talks in Beijing this week, the negative bias on global markets could begin to gather pace. For this morning, there is a mild rebound on risk, with European markets and the commodity currencies finding a bid, but it appears unlikely that these moves will be the start of any sustainable recovery. For that, we need concrete positive steps towards a US/China agreement.

Wall Street closed mixed on Friday with the S&P 500 a shade positive +0.1% at 2708, however, US futures are ticking back lower by around -0.1% today. Asian markets are difficult to get much from today as the Nikkei is closed and China is playing catch-up after a week of Lunar New Year holiday (China Shanghai Composite +1.3%). The European session is starting on a decent note with FTSE futures and DAX futures both around half a percent higher. In forex, there is a mild degree of dollar strength continuing, as EUR/USD edges ever closer to range support, whilst Dollar/Yen again gravitates to 110.00. In commodities, with the dollar gains gold looks to be ticking slightly lower, whilst oil is again around half a percent weaker.
The economic calendar is once more fairly light today, with the UK Prelim GDP for Q4 at 0930GMT being the main focus. Consensus forecasts are looking at quarterly growth of +0.3% and YoY GDP growth at +1.4% (after Q3 saw growth of +0.6% QoQ and +1.7% YoY).
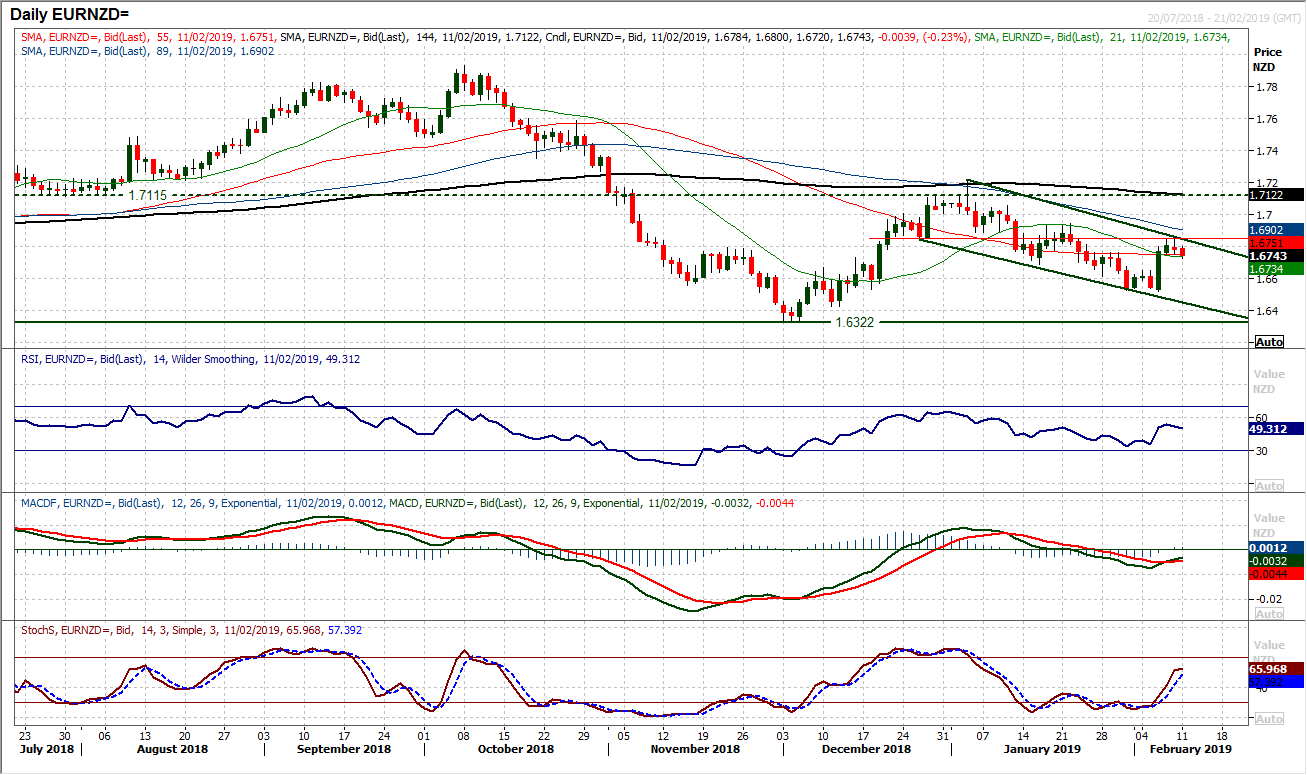
Chart of the Day – EUR/NZD
Ahead of the RBNZ on Wednesday, could it be that Euro/Kiwi is ready to turn a corner? During the month of January (as risk appetite embarked on a broad recovery) EUR/NZD formed a downtrend channel, but this channel is now being challenged. This test comes as momentum indicators have started to throw up a series of bullish signals. The Stochastics have crossed higher and are decisively climbing at four week highs and the MACD lines are posting the first bull cross since December. This is certainly an interesting crossroads, with the RSI is back around 50. Initial resistance to watch is 1.6840 which restricted the gains last week and would be a bull signal if overcome, whilst a move above 1.6940 would open the upside for the medium to longer term pivot at 1.7115. However, although the hourly chart reflects an improvement with a move above 1.6750, this is now a near term pivot and if the market consistently trades below here as momentum indicators become less positive it could suggest a failure in the recovery. A fall below $1.6650 breakout support would be disappointing now.
EUR/USD
As the support of the medium term range around $1.1300 approaches, this is an important time for EUR/USD. There is a run of five consecutive bear candles as the market edged ever closer to the basis of support (a low of $1.1310 today), however is this part of a classic range play, or the time that the breakdown is seen? For now we take it that the market has tested around $1.1300 on numerous occasions in recent months, and only once has there been a decisive breach (in November) only for the market to bounce straight back. Momentum indicators reflect a slip within a range, with the RSI hovering again around 40, whilst MACD and Stochastics are (for now) relatively calm in their drift lower. The last two sessions of decline have seen the daily range well below the current Average True Range of 64 pips, which suggests a lack of conviction in the selling too. The hourly momentum is beginning to show hints of positive divergence too. Above $1.1350/$1.1360 would open another recovery within the range again.

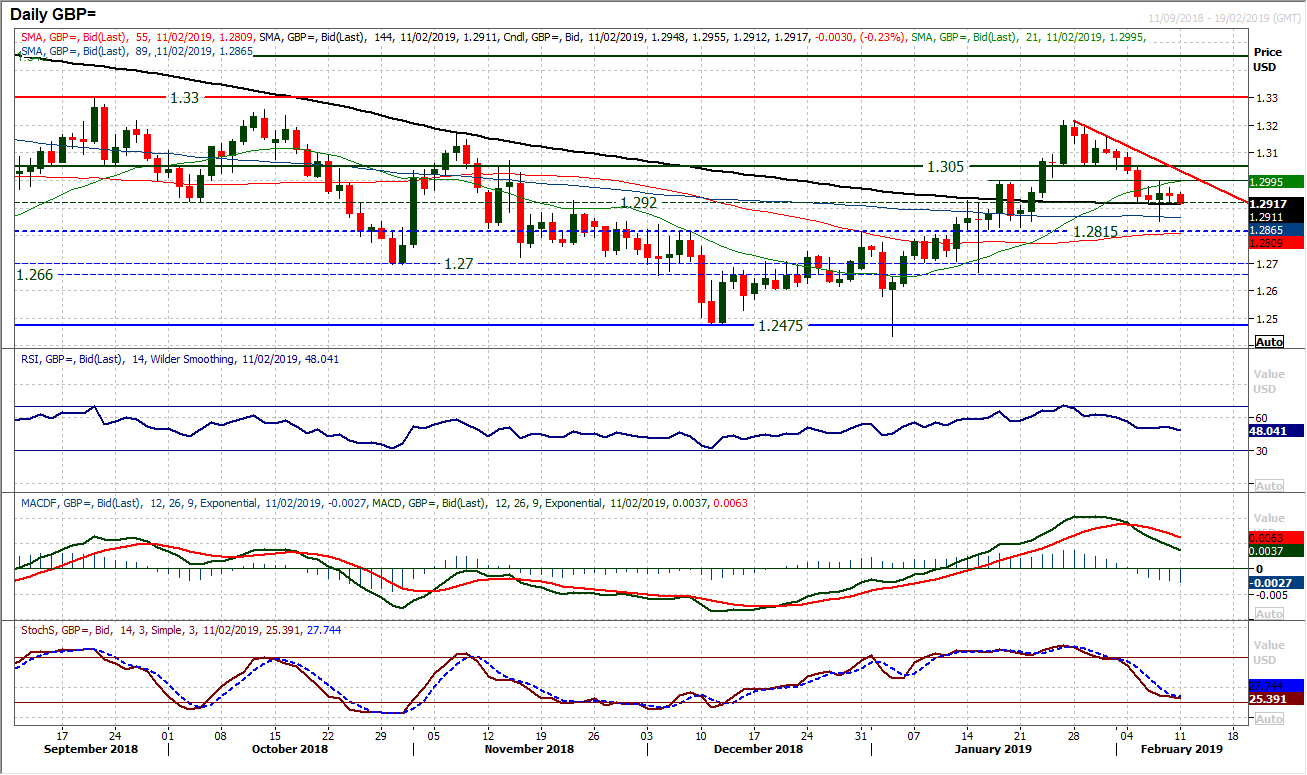
GBP/USD
The corrective momentum has just been settling in recent sessions after there seemed to be something of a low posted at $1.2850 last Thursday. The market has subsequently stabilised again around the $1.2920 old pivot. A series of small bodied candlesticks reflects a consolidation but also a lack of clarity over the direction. Momentum indicators also have a stable look to then now with the RSI and Stochastics slowing their slide. There is an increasing consolidation look to the market now and this is coming under the $1.3000 psychological level and around a clutch of broadly neutral moving averages. Hourly momentum is very neutral now and the market is awaiting its next (likely Brexit related) signal.
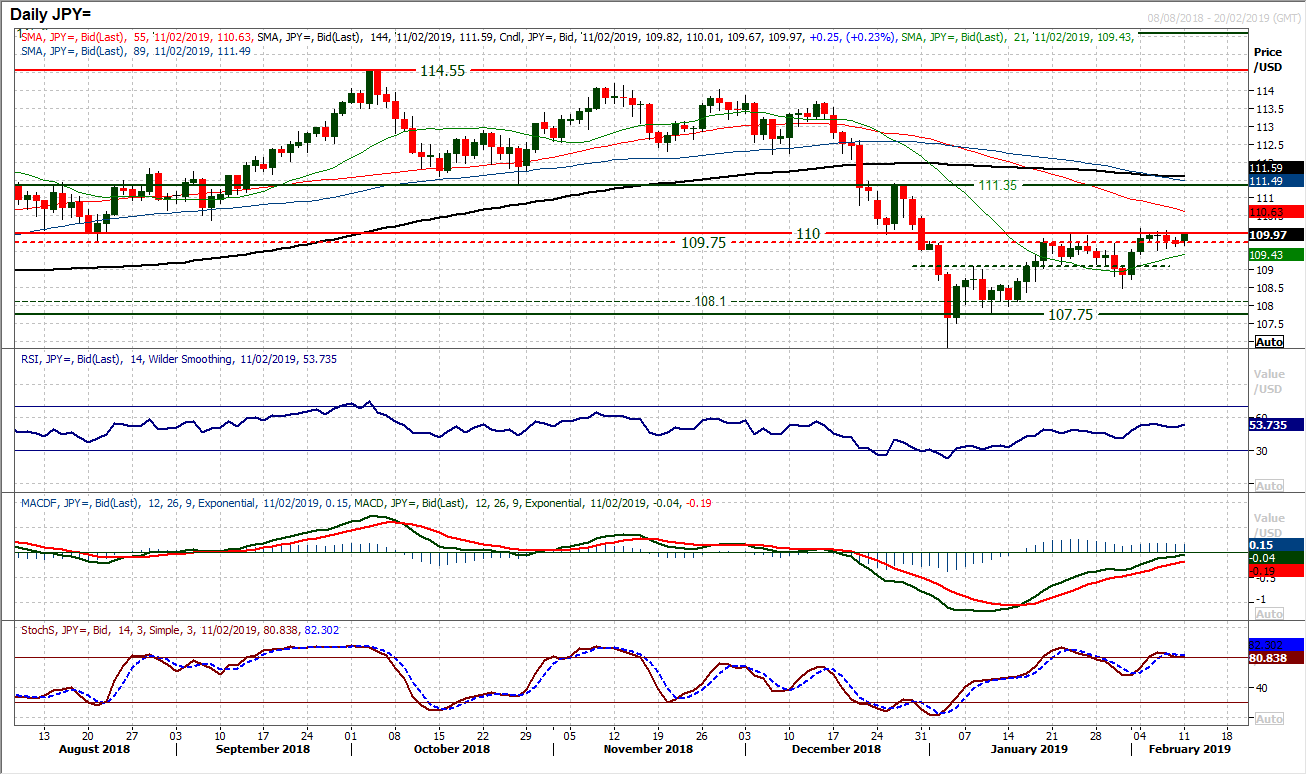
USD/JPY
Dollar/Yen has settled into another of its consolidation phases. It was incredible to see that for almost the whole of last week, every time the market got a sniff of 110.00 it was rejected. This level of resistance (which is an old pivot) was tested time and again only for the bulls to be unable to breakout. They have been having another go today. There is a mild positive bias still with the daily momentum indicators, which does hint at a likely breakout, but it is slow going. Clearing 110.00 on a closing basis (above 110.15 intraday too) would finally open the way towards the next medium term pivot at 111.35. Support is at 109.55 and needs to hold now (certainly on a closing basis) to continue the upside pressure.
Gold
Timing the next move into gold could be the next key decision for the bulls. The long term pivot band $1300/$1310 is a key basis of support and there are signs that the near term corrective move could be coming to an end. Two positive candles mean that support has been left at $1302 above the previous breakout at $1298 and the support of the 12 week uptrend at $1298 today. Daily momentum indicators are steadying after a near term unwind and this looks as though the bulls are ready to jump back in. There is a five day downtrend on the hourly chart which has now been broken and the bulls are testing the near term pivot at $1316. A decisive move above $1316 would open $1326 once more and encourage the bulls. This comes as the hourly momentum is now in more positive configuration with the hourly RSI recently above 60 and MACD lines back above neutral. However, the barrier of the near term pivot at $1316 is key to this, and it needs to be overcome. It is also interesting to see the old pivot around $1308.50 coming back in as a basis of support too. The bulls are on the brink of renewed control, but still we await the move.

WTI Oil
A deterioration in the outlook on WTI which resulted in the six week uptrend being broken, is likely to be more of a consolidation than the beginning of renewed correction. The chart of Brent Crude may show a trading range between the Fib levels more prominently, but for WTI, the support of the 23.6% Fib retracement at $50.50 is still key. However, there is a drag on the momentum indicators which is pulling the Stochastics decisively lower and a bear cross on MACD lines. These indicators need to be watched. Resistance at $55.75 in the past week also marks the 38.2% Fib level (at $55.55) which defines the consolidation broadly in a range of around $5. There is a near term negative bias forming on WTI which could pull the market back for a test of $51.30 initially and the key reaction low at $50.40. However, for now this is just part of a consolidation following the trend break. The hourly chart shows resistance at $53.00/$53.30 needs to be breached to improve the outlook again.

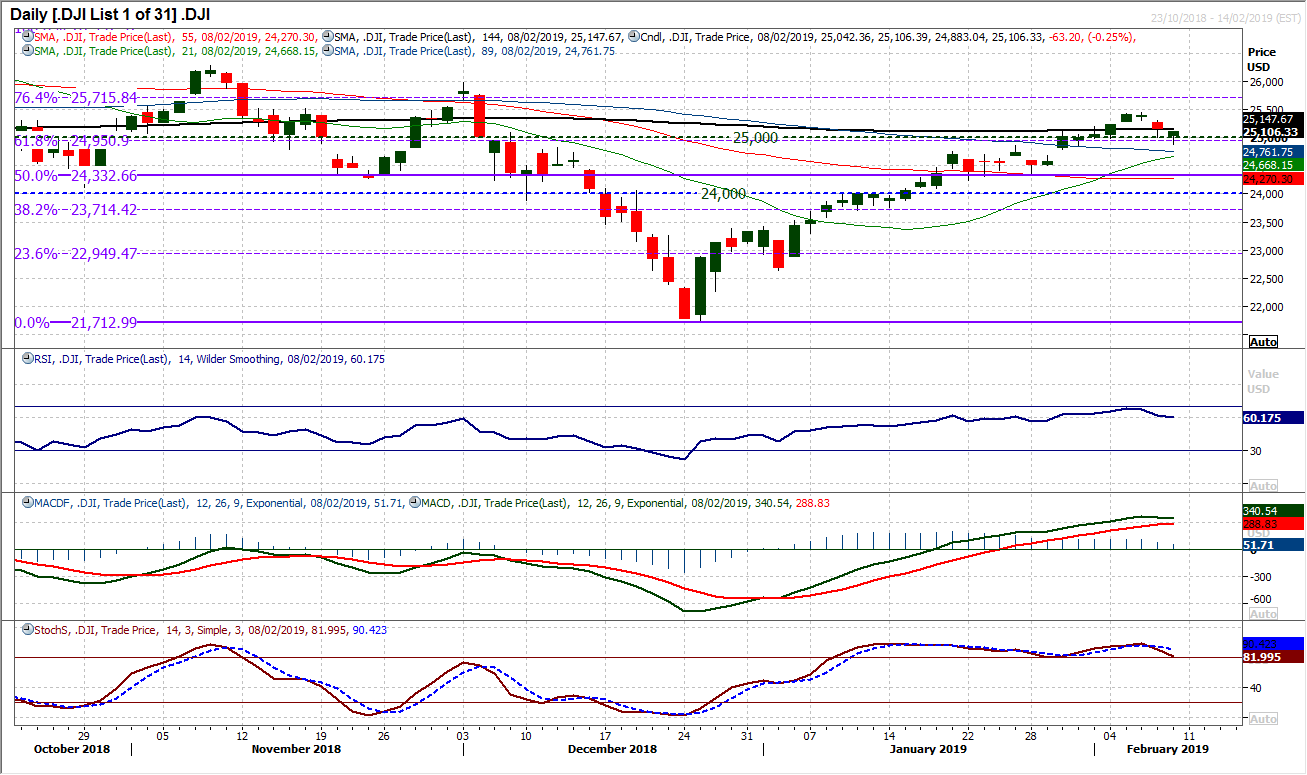
Dow Jones Industrial Average
There are growing suggestions that the bulls are beginning to struggle. A second consecutive negative close on the Dow brings a pivotal moment and the 38.2% Fibonacci retracement could be important now. Fib levels have been good gauges of consolidation during this recovery and a retreat back to 24,950 seems to have been an area the bulls are willing to defend. A positive candle formation (despite the negative close) suggests the bulls have some fighting spirit still. This needs to hold otherwise the deterioration in momentum will grow. For now the positive configurations on RSI (above 60), MACD (above neutral) and Stochastics (above 80) are holding, but are all not far away from posting negative signals. A move below 24,860 would now open the 50% Fib level at 24,333. Resistance is at 25,440.
Author

Richard Perry
Independent Analyst


