Flynn Takes Fifth

Good Morning Traders,
As of this writing 4:15 AM EST, here’s what we see:
US Dollar: Jun. USD is Down at 96.790.
Energies: Jun Crude is Down at 50.38.
Financials: The June 30 year bond is Up 7 ticks and trading at 154.00.
Indices: The June S&P 500 emini ES contract is 12 ticks Higher and trading at 2395.75.
Gold: The June gold contract is trading Down at 1259.40. Gold is 20 ticks Lower than its close.
Initial Conclusion
This is not a correlated market. The dollar is Down- and crude is Down- which is not normal and the 30 year bond is trading Higher. The Financials should always correlate with the US dollar such that if the dollar is lower then bonds should follow and vice-versa. The indices are Up+ and Crude is trading Down- which is correlated. Gold is trading Down- which is not correlated with the US dollar trading Down-. I tend to believe that Gold has an inverse relationship with the US Dollar as when the US Dollar is down, Gold tends to rise in value and vice-versa. Think of it as a seesaw, when one is up the other should be down. I point this out to you to make you aware that when we don’t have a correlated market, it means something is wrong. As traders you need to be aware of this and proceed with your eyes wide open.
At this hour all of Asia is trading mainly lower with the exception of the Hang Seng and Singapore exchanges which are trading higher at this hour. All of Europe is trading higher at this hour.
Possible Challenges To Traders Today
– FOMC Member Kashkari Speaks at 9 AM EST. This is major.
– Flash Manufacturing PMI is out at 9:45 AM EST. This is major.
– Flash Services PMI is out at 9:45 AM EST. This is major.
– New Home Sales are out at 10 AM EST. This is major.
– Richmond Manufacturing Index is out at 10 AM. This is major.
– FOMC Member Kashkari Speaks at 3 PM EST. This is major.
– FOMC Member Harker Speaks at 5 PM EST. This is major.
Treasuries
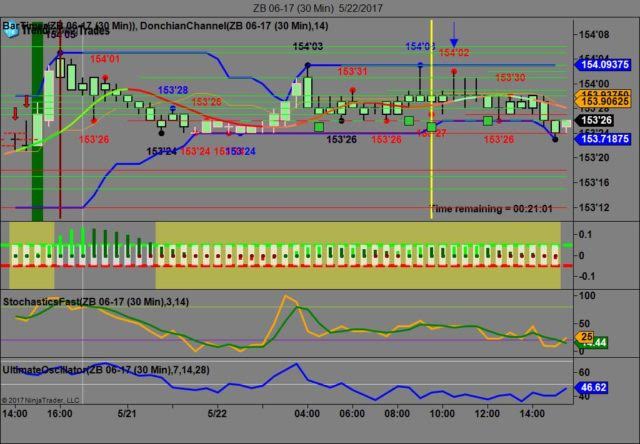
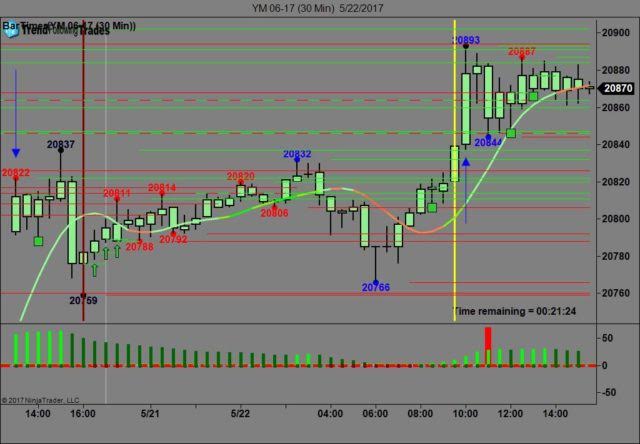
We’ve elected to switch gears a bit and show correlation between the 30 year bond (ZB) and The YM futures contract. The YM contract is the DJIA and the purpose is to show reverse correlation between the two instruments. Remember it’s liken to a seesaw, when up goes up the other should go down and vice versa.
Yesterday the ZB made it’s move at around 10:30 AM EST with no real economic news in sight. The ZB hit a high at around that time and the YM hit a low. If you look at the charts below ZB gave a signal at around 10:30 AM and the YM was moving higher at the same time. Look at the charts below and you’ll see a pattern for both assets. ZB hit a high at around 10:30 AM and the YM hit a low. These charts represent the newest version of Trend Following Trades and I’ve changed the timeframe to a 30 minute chart to display better. This represented a long opportunity on the 30 year bond, as a trader you could have netted about a dozen ticks per contract on this trade. Each tick is worth $31.25. We added a Donchian Channel to the charts to show the signals more clearly.
Charts Courtesy of Trend Following Trades built on a NinjaTrader platform Click on an image to enlarge it.
Bias
Yesterday we gave the markets a neutral bias as the indices had no sense of direction yesterday morning hence the neutral bias. The Dow shot up 90 points and the other indices gained ground as well. Today we aren’t dealing with a correlated market and our bias is to the upside.
Could this change? Of Course. Remember anything can happen in a volatile market.
Commentary
It seems that the market continued its uptrend yesterday as all 3 major indices gained ground despite no economic news to speak of. It would seem that the old adage of “no news is good news” really is true even though it discovered yesterday that Michael Flynn the former NSA Director under Trump will take the fifth amendment when called before a Congressional committee. This is interesting because I seem to recall that when members of organized crime did this they were held in contempt of court and faced prison time. This is just another incident in a long line of fiascos that this young administration faces with only with little more than 100 days in office. Time will tell how this all works out but the pundits in the media are claiming that Flynn is right to do this as the mood and atmosphere seems to be one of vigilante.
Author

Nick Mastrandrea
Market Tea Leaves


