Flattening Yield Curve is Good
In recent months, pundits have cautioned about a flattening yield curve, suggesting it may signal the end of the economic expansion, the end of the bull market, possibly even the end of the world as we know it. There's plenty to worry about in the markets, but in the spirit that knowledge is the enemy of ignorance, let's clear up some myths.
First, what is yield curve steepness? It reflects the relationship between the short end and long end of the yield curve. Got it? Okay, let’s dissect this jargon:
-
The “short end” of the yield curve refers to shorter-term interest rates. This could be the current Federal Funds Target that the Federal Reserve Open Market Committee (FOMC) controls and is colloquially referred to as the current interest rate; more broadly, it is referring to yields on Treasury securities of a few years. In the context of our discussion, many refer to 2 years or 3 years (although some go out as far as 5 years).
-
The “long end” of the yield curve refers to longer-term interest rates. This is often the yield on the 10-year Treasury bond, sometimes the 30-year Treasury bond (also called the “long bond”).
-
For some context, before the financial crisis, it was generally believed the Fed controls the short-end of the yield curve, whereas the long-end of the yield curve is more of a reflection of the longer run potential of the economy and longer run inflation expectations. Since the financial crisis, there’s a plethora of opinions to what extent the Fed’s quantitative easing (QE) has influenced longer-term rates.
-
The steepness of the yield curve is the difference between the yield at the long end of the yield curve and the short end of the yield curve. The 2s10s yield curve, for example, is the yield of the 10-year bond minus 2-year Treasuries plotted across time.
-
The yield curve is steep when short-term rates are lower than long-term rates; it is “flat” when they are the same; and the yield curve is inverted when short-term rates are higher than long-term rates.
-
In a classic banking model, banks borrow money short-term to make long-term loans. As such, when the yield curve is steep, the more money banks lend, the more money they make (assuming their borrowers don’t default); as the yield curve flattens and potentially inverts, margins could get squeezed and potentially become negative. It’s a tad more complicated than that because private borrowers pay a higher rate than that available to the government. An inverted yield curve may suggest that the Federal Reserve wants to slow the economy down.
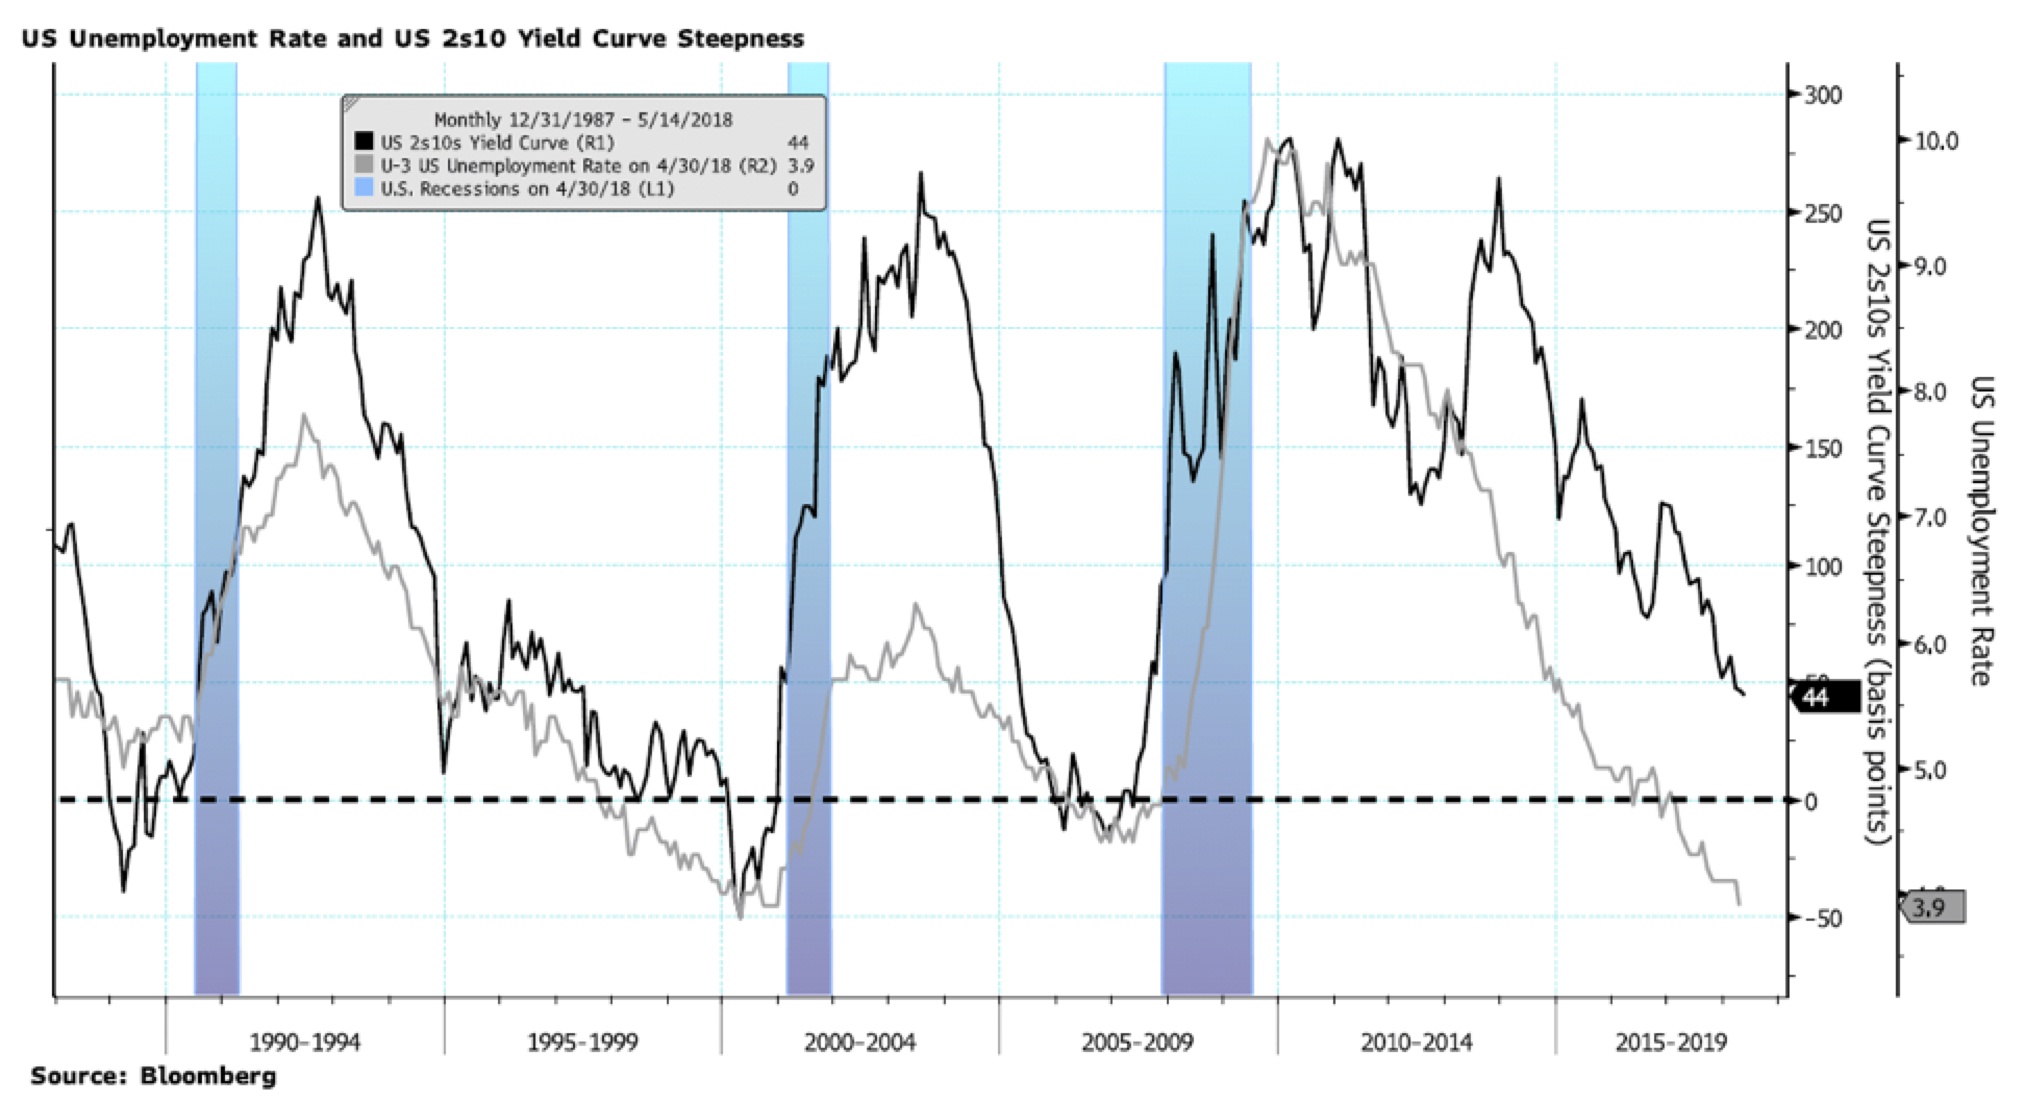
With this context, please look at the chart above which also shows the unemployment rate and recessions. The yield curve has been flattening since 2010; if you listen to financial media, you might think it's a new development. The fact that the yield curve is flattening or at a relatively flat level does not really mean anything by itself, for example the yield curve was relatively flat in the second half of the 1990s and economic growth remained strong for years. The advertising-based media model means that media outlets want your attention all the time, and therefore they tend to generate fear inducing headlines like "US Treasury yield curve hasn't been this flat since 2007" just to get you to click.
Ahead of the financial crisis in 2007, the yield curve was actually steepening, not flattening. In our assessment, the proper comparison between now and the prior cycle is actually 2005, not 2007. The point is that you often see the yield curve actually steepening within the year prior to a recession, having been inverted prior to the steepening. Please see the black line on the above chart.
Tying it back to markets, the S&P 500 topped in October 2007, well after inversion and while yield curve steepening was already underway.
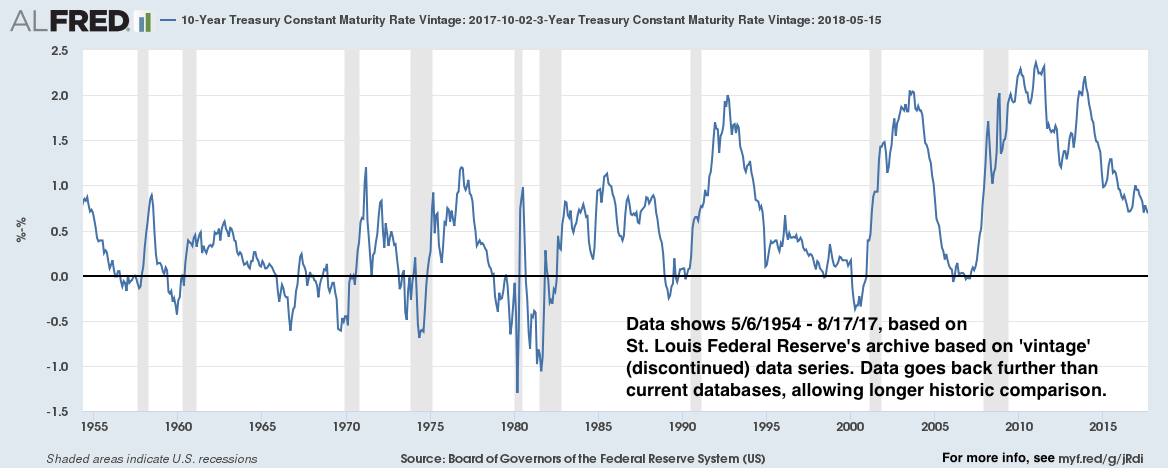
Taking a longer-term perspective: for the nine recessions since 1954, all were preceded by a 3s10s inversion, the average length of time before the subsequent recession was 15 months, with 10 months being the shortest amount of time, and 20 months the longest. There were four false signals: in 1965, in 1967, in 1971 and in 1998. So historically a 3s10s inversion was a necessary but not sufficient signal for a recession, and there was at least a 10-month lag before the subsequent recession started.
Even given the historical evidence, it is certainly possible that the next recession will start without the yield curve inverting ahead of time. However, if history is any guide, the balance of probabilities seems it suggest that inversion will happen again prior to the next recession. But that doesn’t mean a flattening yield curve is an imminent warning sign. Instead, in today’s context, we believe a better characterization may be that the flattening yield curve is a reflection that the Fed believes the brakes ought to be applied (even if they want to do so ‘gradually’) to a strong economy.
Will it end in a recession? Of course. The probability of a recession is 100%, as J.P. Morgan CEO Jamie Dimon quips; the question is not whether a recession will happen, but when.
In taking the yield curve steepness as a model, we should take note of any inversion. That said, we would likely be far more concerned about a downturn in the economy should the yield curve steepen once again after the inversion has occurred.
For context, the US 10 year yield is, as of this writing, just under 3%; it hit a low of 1.36% in 2016. The Fed funds rate right now is set to be between 1.50% and 1.75%, so if the economic outlook deteriorated, the U.S. 10-year yield should fall below this level to invert the yield curve. More likely, in our assessment, is that the Fed continues to raise rates, pushing shorter-term rates higher, thus gradually flattening the yield curve further.
The exceptions to witnessing a yield curve steepening prior to recession were in the late 1970s and early 1980s, a time when monetary policy was very volatile in large part due to the fact that inflation rates were running high. We will be publishing a research report on inflation in the coming days, as well as hold a webinar on inflation topic on May 24. Notably, we will look at how demographics may have been a substantial contributing factor to inflationary pressures in the 1970s.
It is in the above context that we view a flattening yield curve (that is not inverted) as a positive indicator for the business cycle over roughly a six-month outlook. The steepness of the yield curve is but one indicator of where we are in the business cycle. Part of the confusion with financial market discussions generally may come from a lack of distinguishing time frames. Hence, for the time being, the flattening yield curve is, in our assessment, a positive for the economy over the near term.
Author

Axel Merk
Merk Hard Currency Fund
Axel Merk is the Founder and President of Merk Investments. Merk is an expert on macro trends, hard money, international investing and on building sustainable wealth.


