Five market relationships traders rely on – Which ones still work?

Tariffs, geopolitical tensions, changing interest-rate expectations and the policy direction of the Trump administration have altered how global markets respond to traditional drivers. Relationships that traders once considered dependable have weakened, strengthened or temporarily reversed. At different points, we have seen gold and the US dollar rise together, US equities move in the same direction as the dollar and USD/CAD climb despite higher oil prices. Gold has also occasionally risen on positive geopolitical developments, such as reports of progress in US-Iran ceasefire talks, while selling off on negative headlines. But which of the market’s most popular relationships still work, and which ones are beginning to break down?
Is Gold still a hedge against the US Dollar?
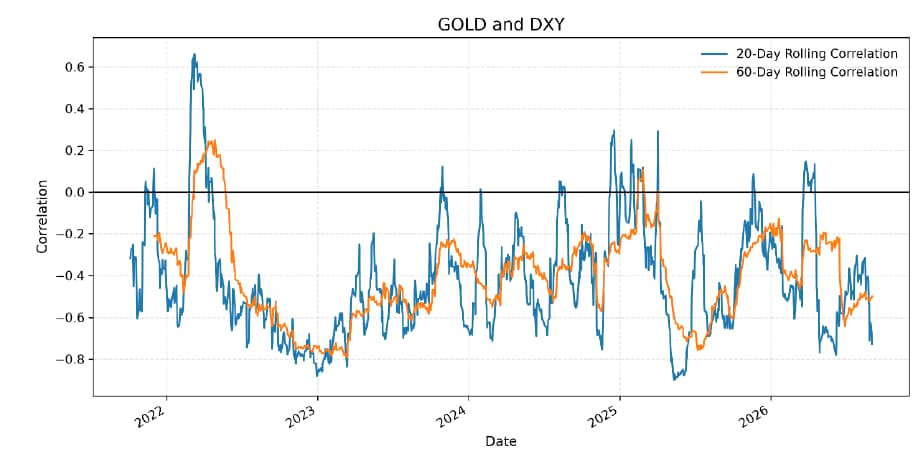
The negative relationship between gold and the US dollar has held for years and remains one of the major pillars of trading the gold market. A stronger dollar generally puts pressure on gold, while a weaker dollar tends to support it.
Over the past five years, this relationship has largely held, although both the 20-day and 60-day rolling correlations briefly moved into positive territory in 2023. The mean 60-day correlation stands at -0.41, while the latest reading is -0.50, suggesting that the inverse relationship has recently strengthened.
Gold maintained a negative correlation with DXY across almost 95% of the 60-day windows tested. This suggests that gold remains an effective hedge against broad US-dollar strength, even though geopolitical risk, inflation expectations and central-bank demand may periodically become more dominant price drivers.
Can Gold continue to defy higher Treasury yields?
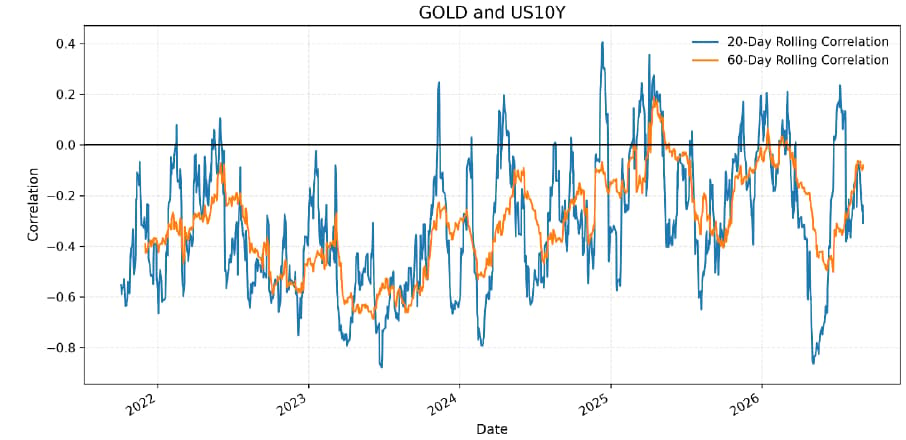
Gold’s relationship with the US 10-year Treasury yield has historically been negative and remained in negative territory during most of the period measured. However, the relationship appears to have weakened considerably in 2026.
The relationship recorded directional consistency of more than 96%, but its mean 60-day correlation was only -0.31. Its latest reading stood at -0.08 as of September 3, indicating that gold has recently become almost indifferent to movements in the US 10-year yield.
Other factors, including geopolitical risk, central-bank demand, inflation concerns and movements in the dollar, may currently be having a greater influence on gold. A relationship can remain slightly below zero most of the time and produce high directional consistency without being strong enough to offer much trading value.
Are EUR/USD and GBP/USD still the same Dollar trade?
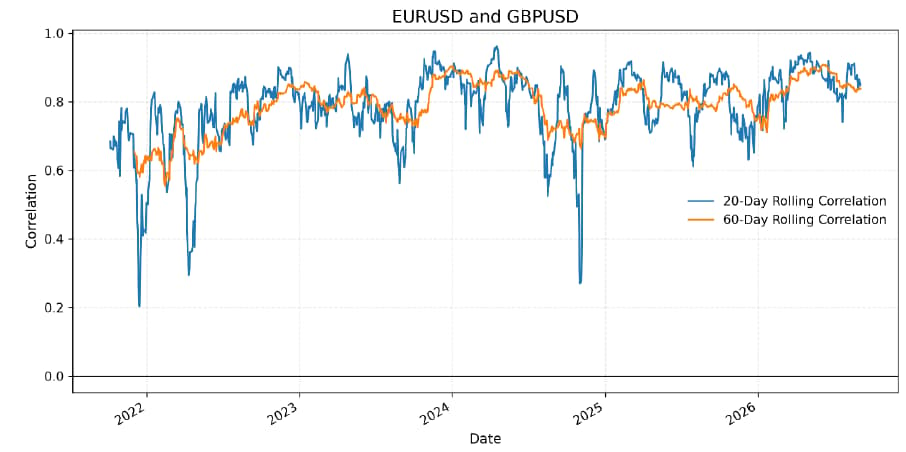
The relationship between EUR/USD and GBP/USD is one of the most widely discussed in the forex market, and the chart above confirms why. Over the past five years, their 60-day correlation remained firmly positive, producing a mean reading of 0.79.
The relationship also recorded directional consistency of 100%, meaning that the correlation between EUR/USD and GBP/USD remained positive across every valid 60-day window tested. Its latest reading of 0.84 is even higher than the five-year mean, suggesting that the relationship has strengthened recently.
Broad US-dollar movements remain the common driver of both pairs, even when expectations for the Bank of England and European Central Bank differ. Of all the relationships tested, this remains the strongest and most dependable.
Does a stronger Dollar still mean weaker US equities?
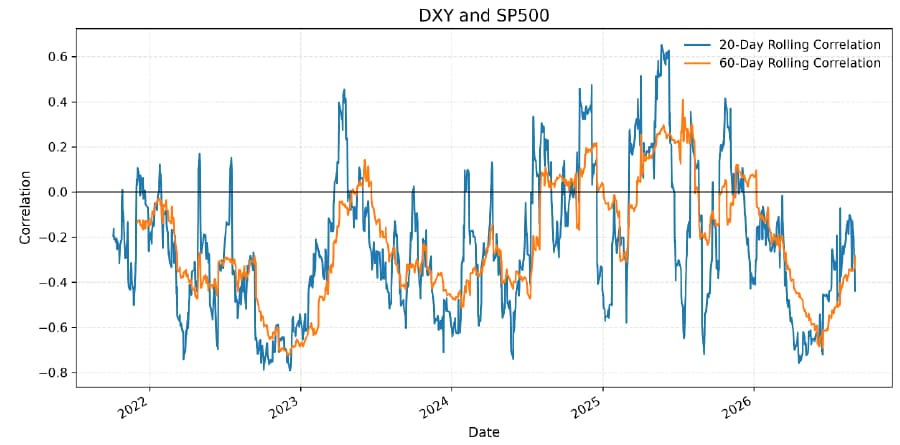
The relationship between the US dollar and the S&P 500 was predominantly negative between 2022 and 2024. However, it became more unstable between 2025 and 2026, periodically moving into positive territory before returning to its expected negative direction.
This period of instability coincided with the return of President Trump’s trade policies in 2025 and the US-Iran conflict in 2026. The mean 60-day correlation stands at -0.23, while the latest reading as of September 3 was -0.28. The relationship also recorded directional consistency of 77.53%.
The relationship is therefore currently behaving as expected, but it is not strong enough to suggest that DXY alone determines the direction of US equities. Earnings expectations, interest rates, fiscal policy and broader risk sentiment can easily outweigh the effect of the dollar.
Is AUD/JPY still a reliable risk-appetite indicator?
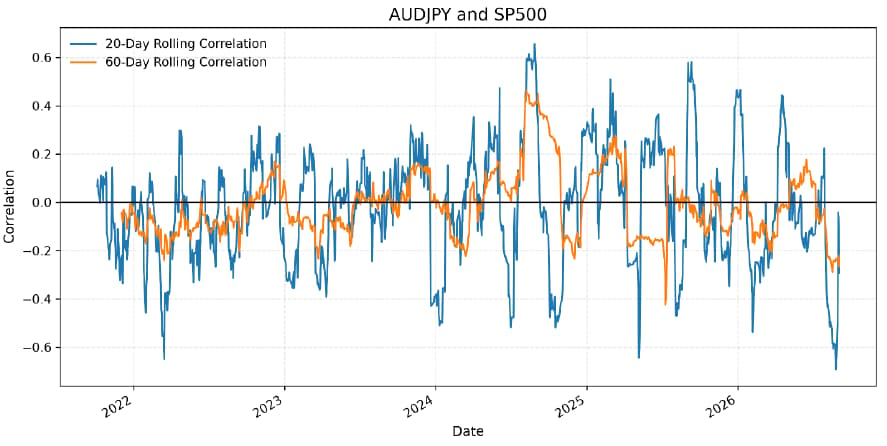
The Australian dollar is traditionally considered a high-beta, risk-sensitive currency, while the Japanese yen is widely viewed as a safe haven. This makes AUD/JPY one of the market’s best-known risk-appetite indicators: the pair is generally expected to rise when market sentiment improves and fall when investors become more defensive.
That reasoning explains its expected positive relationship with the S&P 500, which is commonly used as a benchmark for broader risk sentiment. However, the five-year results do not support AUD/JPY’s reputation as a reliable equity-market proxy.
Its mean 60-day correlation was virtually zero at -0.01, while its latest reading stood at -0.26. The relationship also moved in its expected positive direction during only 40.24% of the periods measured. This suggests that AUD/JPY has increasingly been driven by factors outside general risk sentiment, including differences between Reserve Bank of Australia and Bank of Japan policy expectations, commodity prices and movements in Japanese bond yields.
Conclusion
The results show that traditional market relationships have not disappeared, but their reliability differs significantly. EUR/USD and GBP/USD remain the strongest pair tested, recording a mean 60-day correlation of 0.79 and directional consistency of 100%. Gold’s inverse relationship with DXY also remains dependable and has strengthened recently, with its latest correlation reaching -0.50.
Author

Olalekan Akinola
Independent Analyst
Olalekan Akinola is a financial-markets analyst and writer with five years of experience covering forex, commodities, and global macroeconomic developments.

















