Labor day doesn't propel markets either

USD: Sep '26 is Up at 98.805
Energies: Oct '26 Crude is Up at 95.35.
Financials: The Sep '26 30 Year T-Bond is Higher by 3 ticks and trading at 108.15.
Indices: The Sep '26 S&P 500 emini ES contract is 82 ticks Lower and trading at 7760.00.
Gold: The Dec'26 Gold contract is trading Down at 4438.20
Initial conclusion
This is not a correlated market. The USD is Up and Crude is Up which is not normal, and the 30-Year T-Bond is trading Higher. The Financials should always correlate with the US dollar such that if the dollar is Higher, then the bonds should follow and vice-versa. The S&P is Lower and Crude is trading Higher which is correlated. Gold is trading Lower which is correlated with the US dollar trading Up. I tend to believe that Gold has an inverse relationship with the US Dollar as when the US Dollar is down, Gold tends to rise in value and vice-versa. Think of it as a seesaw, when one goes Up the other goes Down. All of Asia traded Lower except the Shanghai exchange. All of Europe is trading Mixed.
Possible challenges to traders
- ADP Weekly Employment Change is out at 8:15 AM EST. Major.
- 10 Year Bond Auction starts at 1 PM EST. Major.
We've elected to switch gears a bit and show correlation between the 2-year Treasury notes (ZT) and the S&P futures contract. The YM contract is the Dow Jones Industrial Average, and the purpose is to show reverse correlation between the two instruments. Remember it's likened to a seesaw, when up goes up the other should go down and vice versa.
Yesterday the ZT nosed dived at around 8:30 AM EST with no economic news to report. The Dow gained ground at around the same time. Look at the charts below and you'll see a pattern for both assets. The ZT lost ground at around 8:30 AM EST and the Dow climbed Higher around the same time. These charts represent the newest version of Bar Charts, and I've changed the timeframe to a 15-minute chart to display better. This represented a Short opportunity on the 2-year note, as a trader you could have netted about 20 plus ticks per contract on this trade. Each tick is worth $6.25. Please note: the front month for the ZT is now Sep '26. I've changed the format to filled Candlesticks (not hollow) such that it may be more apparent and visible.
Charts courtesy of BarCharts
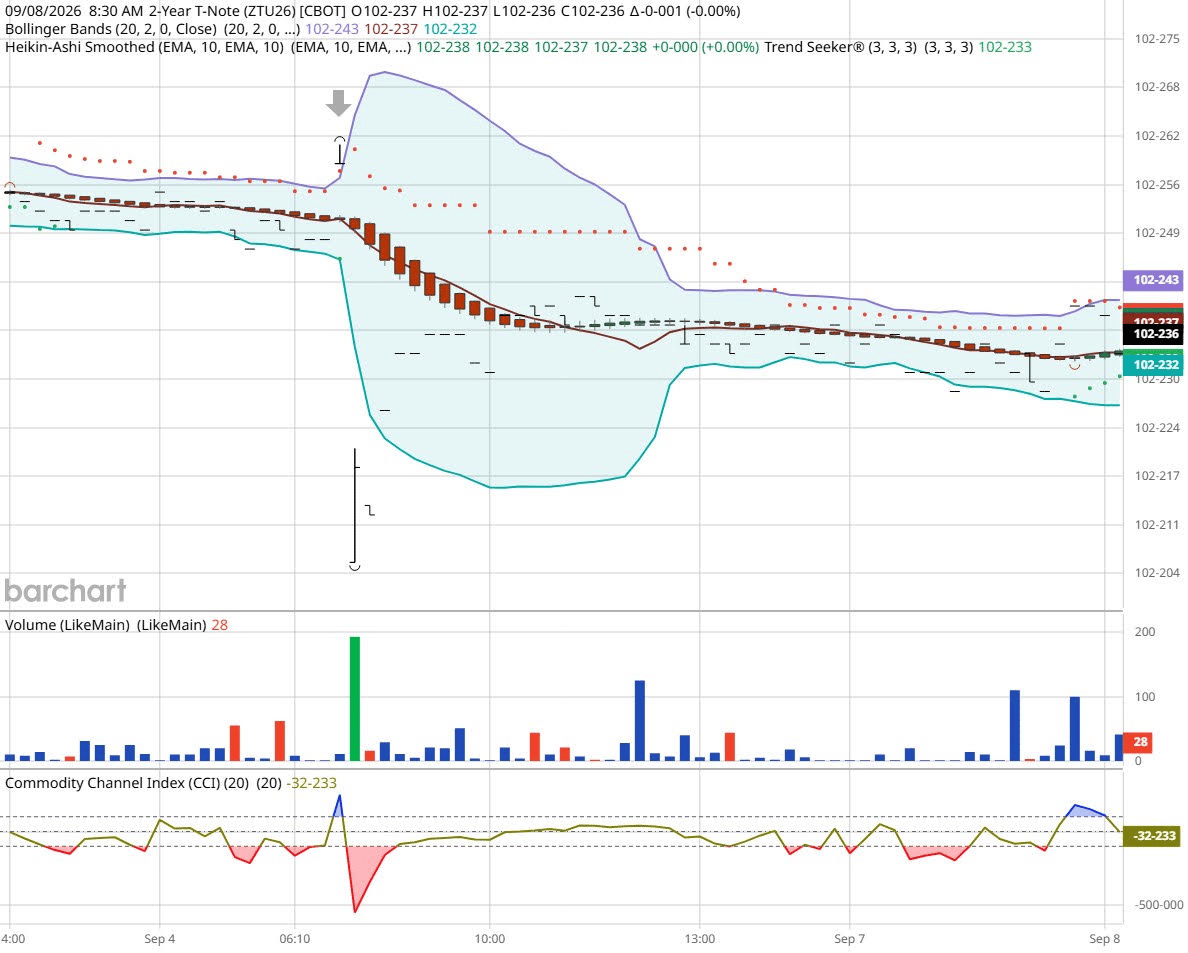
ZT -Sep 26 - 9/8/26
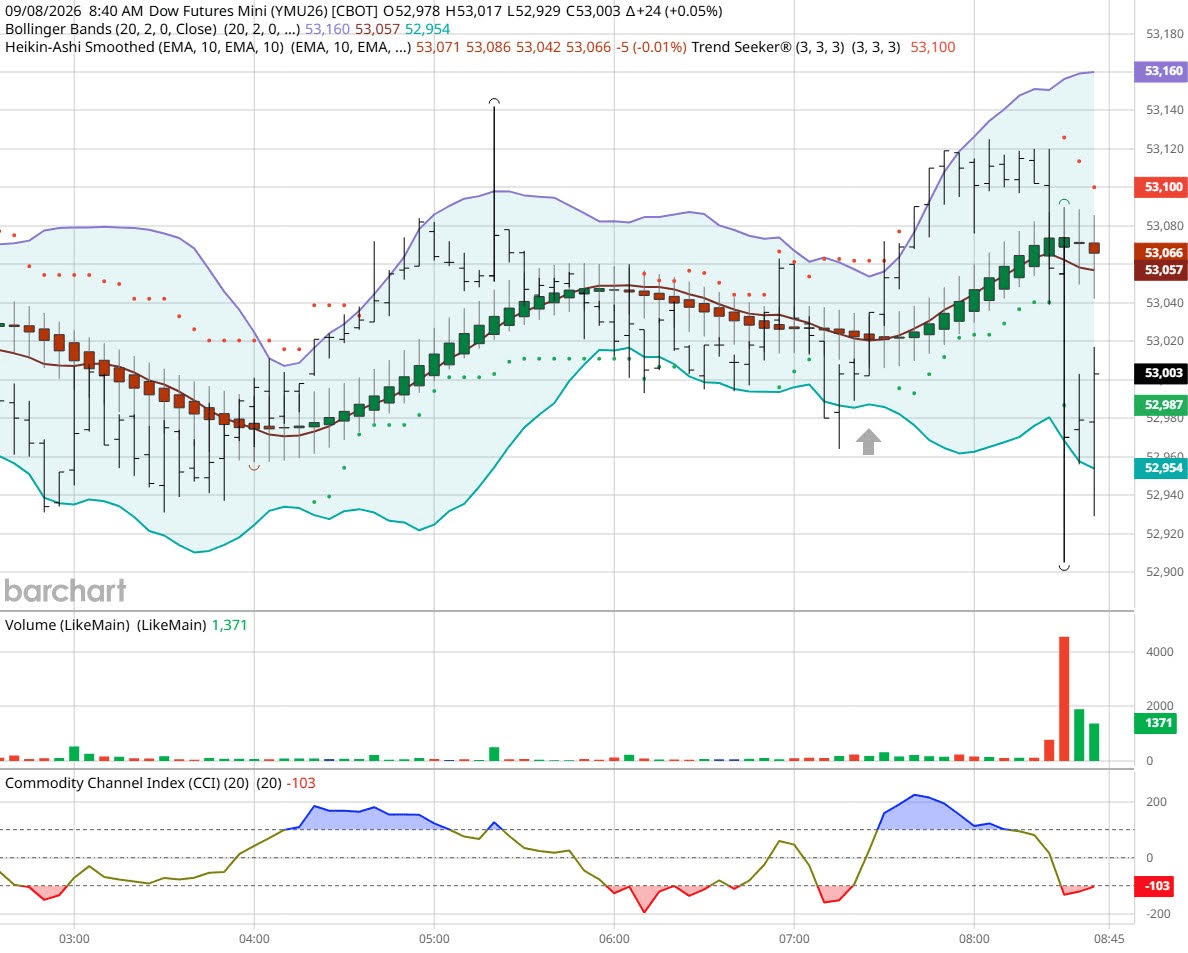
Dow - Sep 2026- 9/8/26
Bias
Yesterday we gave the markets a Neutral or Mixed bias as it was the day after a major holiday in the United States. The Dow dropped 628 points, and the other indices lost ground as well. Today our bias is to the Downside.
Could this change? Of Course. Remember anything can happen in a volatile market.
Commentary
Yesterday the markets lost ground as the Canadian tariffs took effect yesterday and the Dow dropped 628 points and the other indices closed Lower as well. Will this continue? Only time will tell. Want to learn Market Correlation and determine market direction hours before the Opening Bell?
Author

Nick Mastrandrea
Market Tea Leaves
Nick Mastrandrea over 20 years experience in trading and formerly held a NASD Series 7. He currently holds a NJ Life, Health and Variable Authority. Nick is a published writer and his work has appeared in Futures Magazine, TraderPlanet and others.
















