Finally!!!

Good Morning Traders,
As of this writing 4 AM EST, here’s what we see:
US Dollar: Dec. USD is Down at 97.790.
Energies: December Crude is Up at 51.12.
Financials: The Dec 30 year bond is Up 6 ticks and trading at 164.15.
Indices: The December S&P 500 emini ES contract is 17 ticks lower and trading at 2127.75.
Gold: The December gold contract is trading Up at 1263.00. Gold is 1 tick higher than its close.
Initial Conclusion
This is not a correlated market. The dollar is Down- and crude is Up+ which is normal but the 30 year bond is trading Up. The Financials should always correlate with the US dollar such that if the dollar is lower then bonds should follow and vice-versa. The indices are Down and Crude is trading Up which is correlated. Gold is trading Up which is correlated with the US dollar trading Down. I tend to believe that Gold has an inverse relationship with the US Dollar as when the US Dollar is down, Gold tends to rise in value and vice-versa. Think of it as a seesaw, when one is up the other should be down. I point this out to you to make you aware that when we don’t have a correlated market, it means something is wrong. As traders you need to be aware of this and proceed with your eyes wide open.
Asia traded mixed with half the exchanges higher and the other half lower. As of this writing all of Europe is trading lower.
Possible Challenges To Traders Today
– Building Permits is out at 8:30 AM. This is major.
– Housing Starts is out at 8:30 AM EST. This is major.
– Crude Oil Inventories is out at 10:30 AM EST. This is major.
– Beige Book is out at 2 PM EST. This is major.
Treasuries
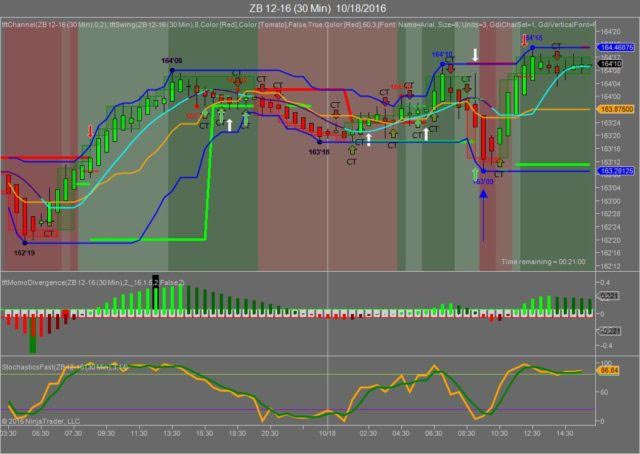
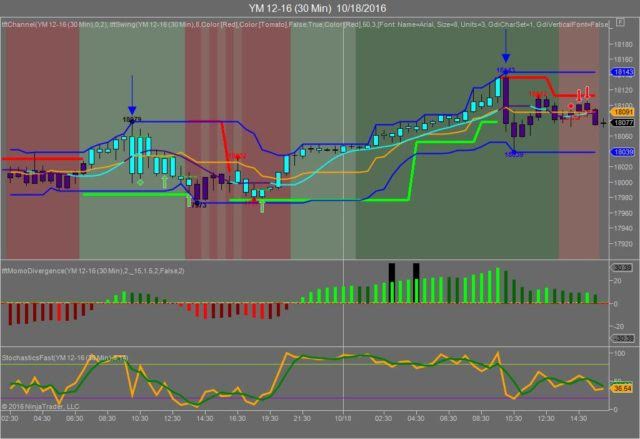
We’ve elected to switch gears a bit and show correlation between the 30 year bond (ZB) and The YM futures contract. The YM contract is the DJIA and the purpose is to show reverse correlation between the two instruments. Remember it’s liken to a seesaw, when up goes up the other should go down and vice versa.
Yesterday the ZB made it’s move at around 10 AM EST when most of the economic news was reported. The ZB hit a low at around that time and the YM hit a high. If you look at the charts below ZB gave a signal at around 10 AM EST and the YM was moving lower at the same time. Look at the charts below and you’ll see a pattern for both assets. ZB hit a low at around 10 AM EST and the YM hit a high. These charts represent the latest version of Trend Following Trades and I’ve changed the timeframe to a 30 minute chart to display better. This represented a long opportunity on the 30 year bond, as a trader you could have netted about 30 plus ticks per contract on this trade. Each tick is worth $31.25. We added a Donchian Channel to the charts to show the signals more clearly.
Charts Courtesy of Trend Following Trades built on a NinjaTrader platform
Bias
Yesterday we gave the markets an upside bias as our rules of market correlation called for such. The markets didn’t disappoint as the Dow rose 75 points and the other indices gained ground as well. Today our bias is to the downside.
Could this change? Of Course. Remember anything can happen in a volatile market.
Commentary
Yesterday the Core CPI and CPI numbers came out at 8:30 AM EST. and virtually came in mellow as the Core number was 0.1% versus 0.2% expected. This is not inflationary and the Fed should take note of this. The market celebrated that fact by going higher. Tonight we have the final Presidential debate and hopefully this turns into something more meaningful than the mud slinging we’ve been seeing. Donald Trump has already accused the election of being rigged in favor of the Hillary and the Democrats when in reality it’s his own mouth that getting him deeper in trouble. Mind you the election hasn’t taken place yet and he’s accusing virtually everyone of rigging. I would venture to say that if he doesn’t win in November, he’ll demand a nationwide recount. But as always, only time will tell.
Author

Nick Mastrandrea
Market Tea Leaves


