|

Fibonacci retracements analysis: Bitcoin and Ethereum

BTCUSD, “Bitcoin vs US Dollar”

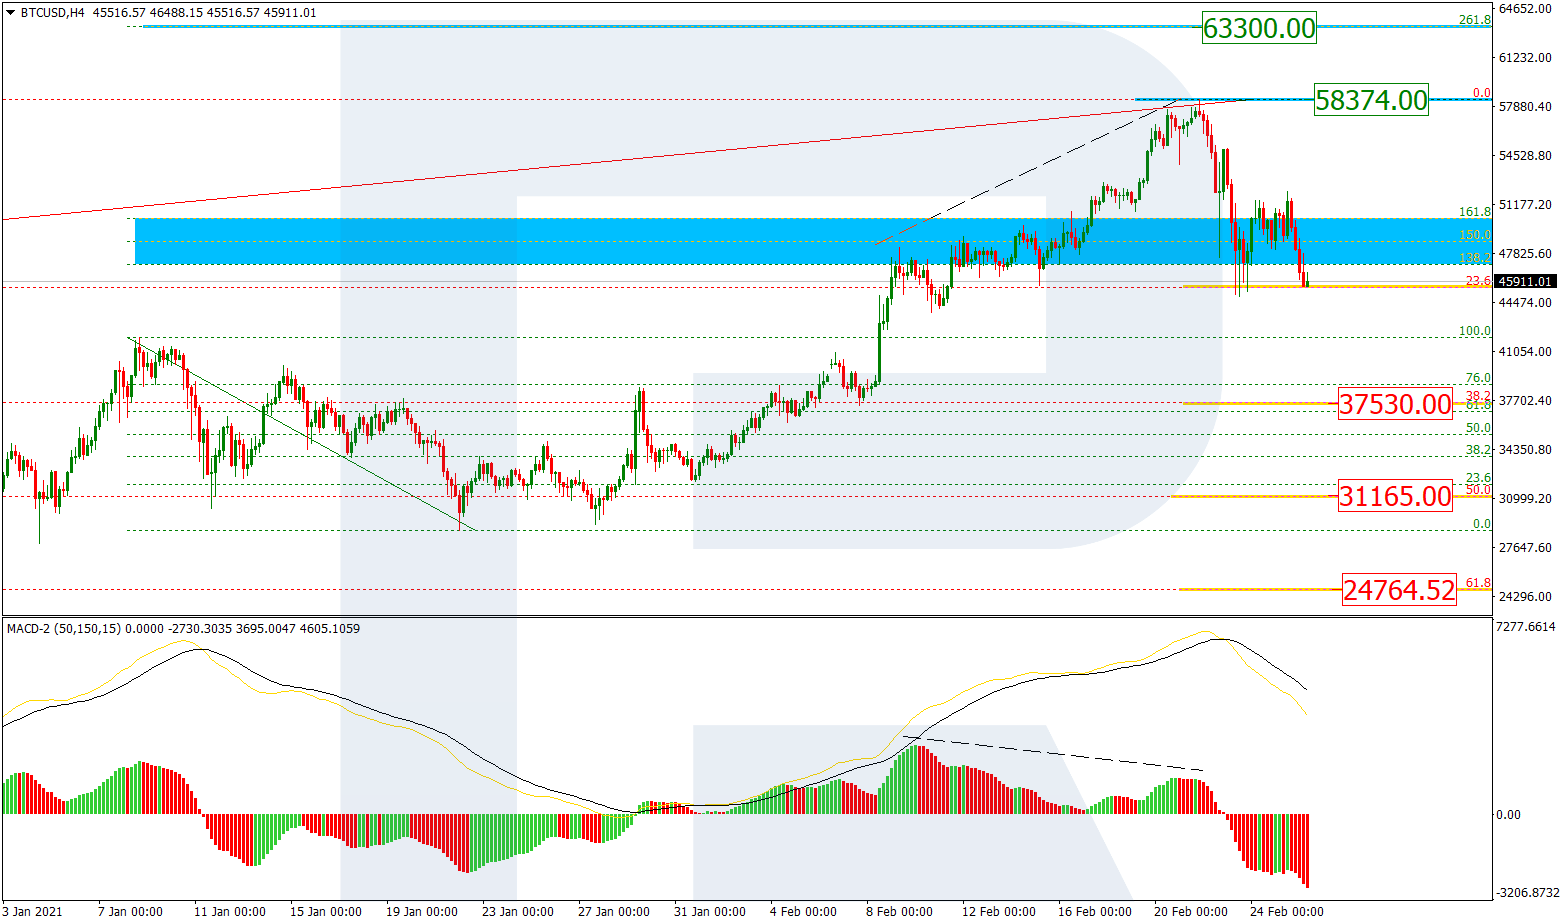
As we can see in the H4 chart, after failing to reach 261.8% fibo at 63300.00, BTCUSD started plummeting due to divergence on MACD. The situation may indicate the start of a new mid-term or even long-term correction. The first descending impulse has already reached 23.6% fibo, while the next ones may continue towards 38.2%, 50.0%, and 61.8% fibo at 37530.00, 31165.00, and 24764.52 respectively. The resistance is the high at 58374.00.

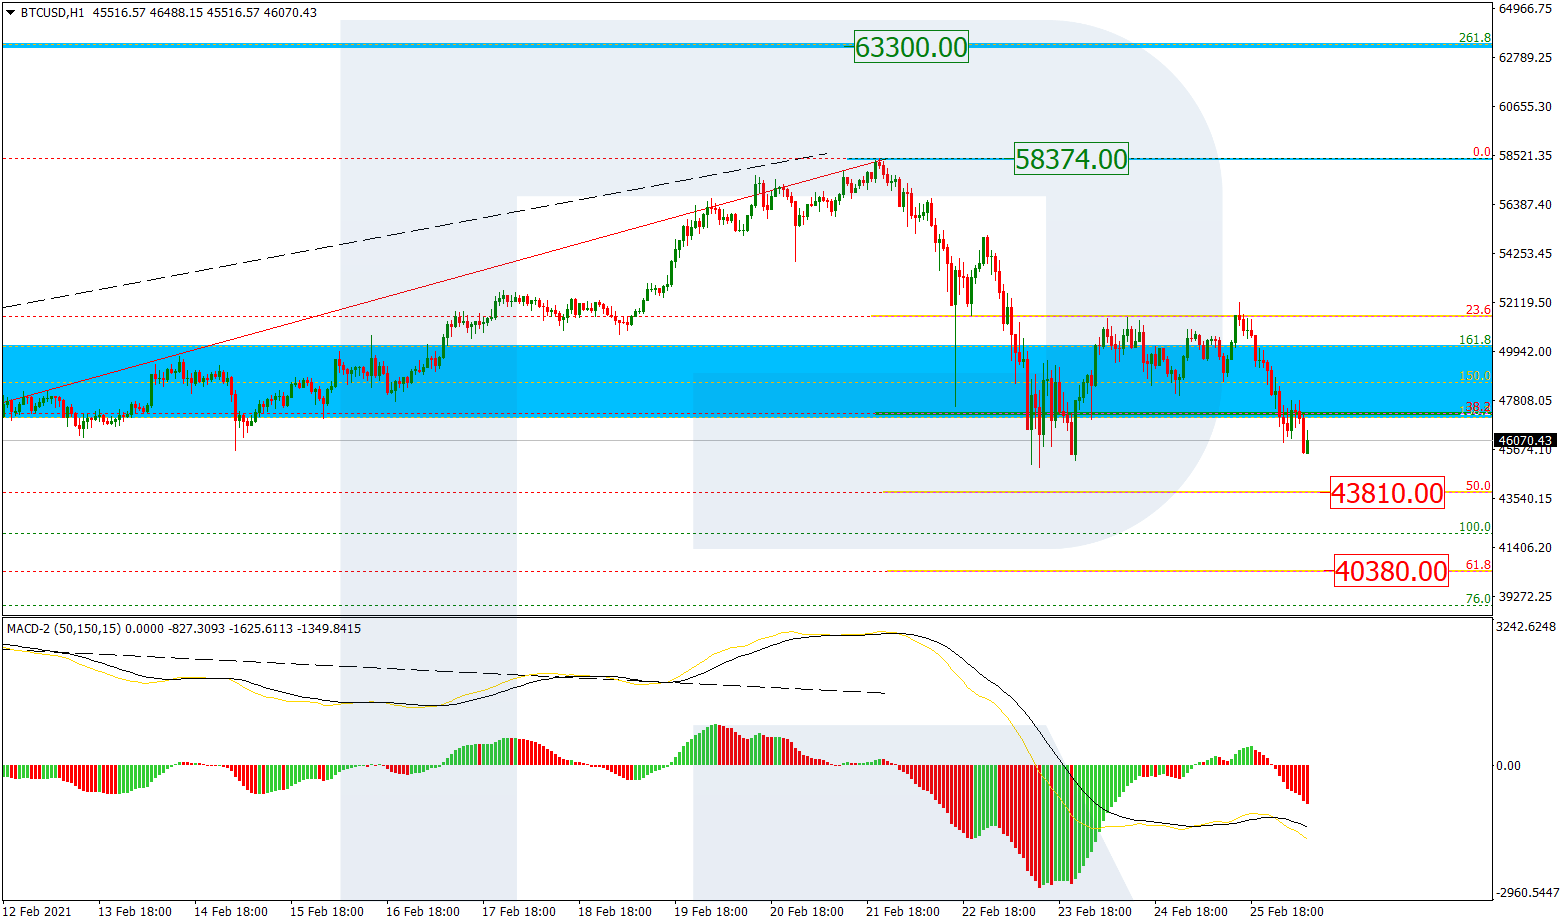
The H1 chart shows a descending correction, which has already broken 38.2% and is currently heading towards 50.0% and 61.8% fibo at 43810.00 and 40380.00 respectively.

ETHUSD, “Ethereum vs. US Dollar”

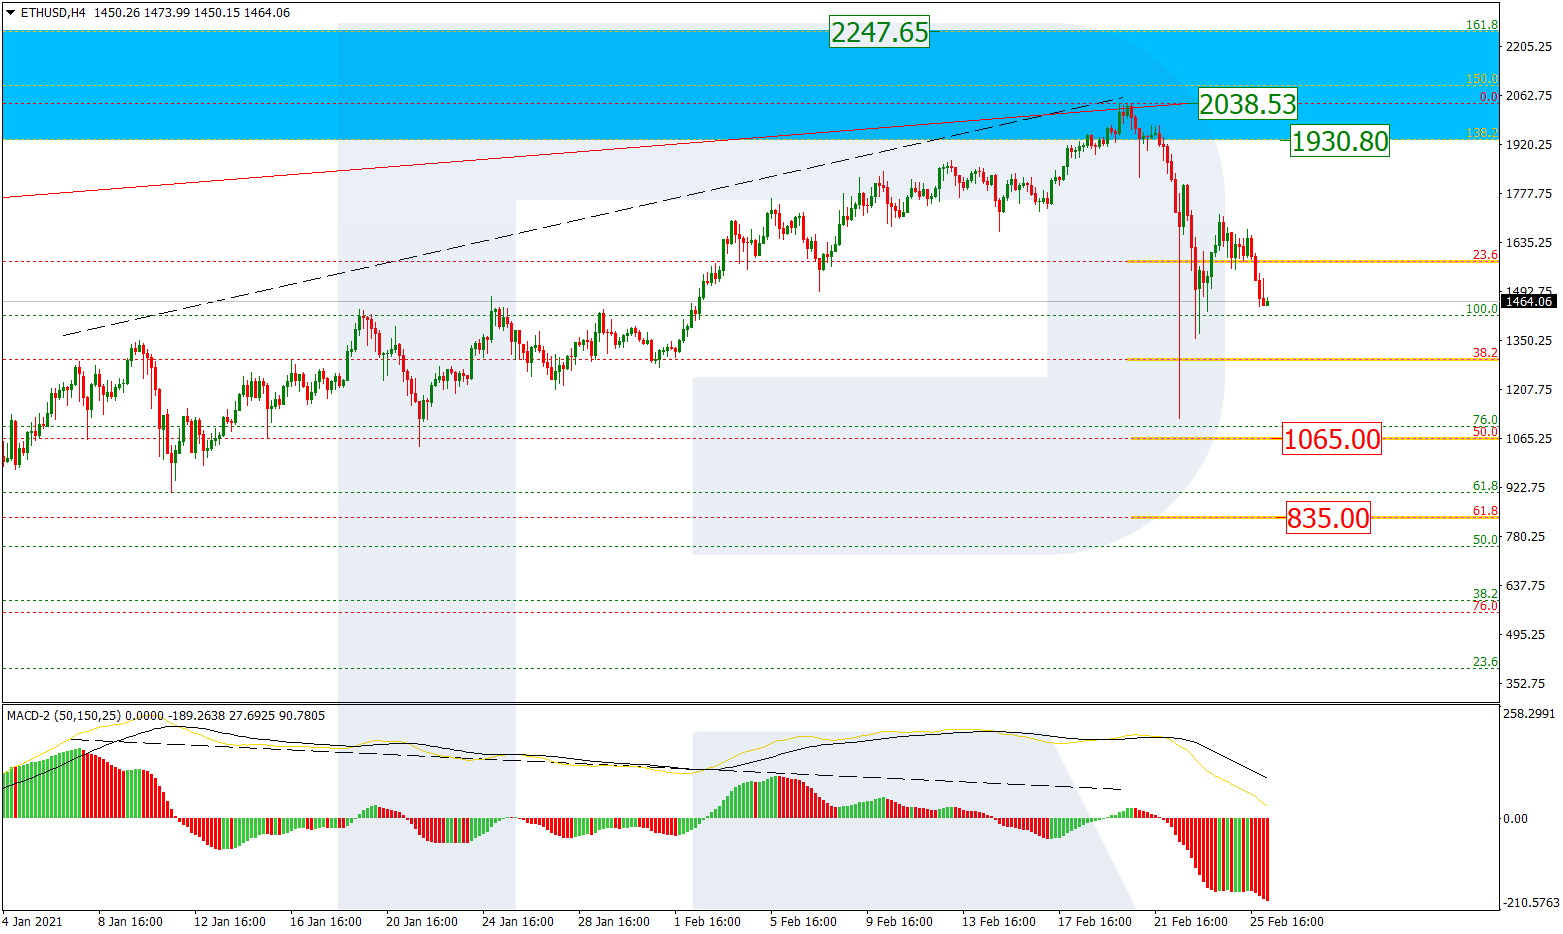
In the H4 chart, after testing the post-correctional extension area between 138.2% and 161.8% fibo at 1930.80 and 2247.65 respectively, ETHUSD started plunging due to divergence on MACD. The first descending impulse broke 38.2% fibo but failed to reach 50.0% fibo at 1065.00. the current situation may be described as a correction within a correction. Possibly, the pair may complete the internal correction and resume falling to reach 61.8% fibo at 835.00. The key resistance is the high at 2038.53.

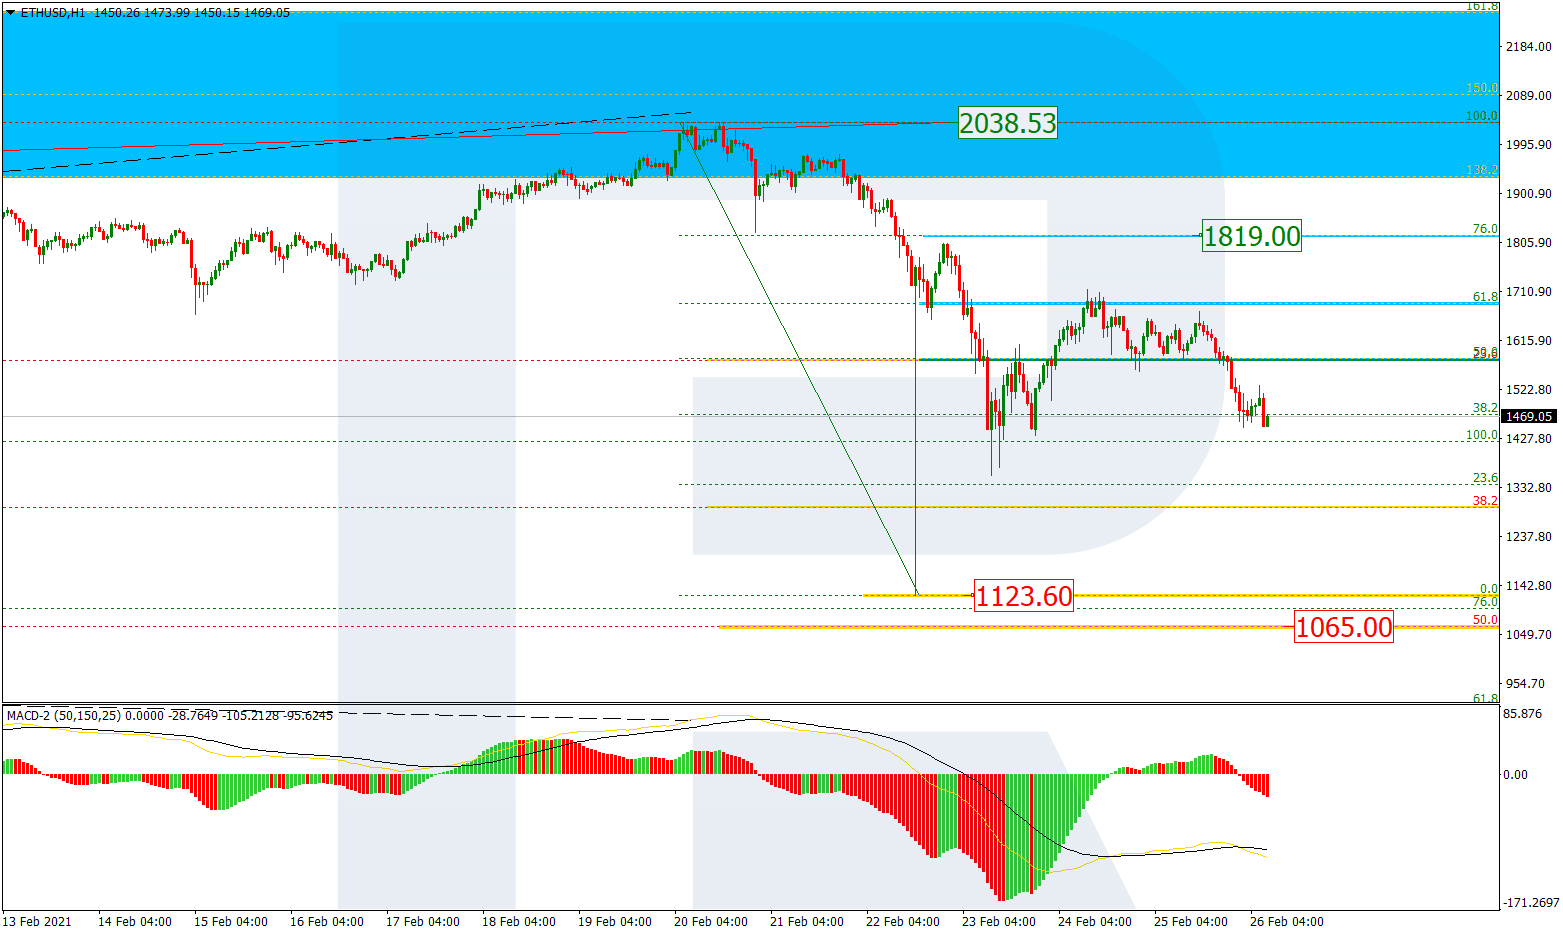
The H1 chart shows a more detailed structure of the current pullback after the descending impulse, which managed to reach 61.8% fibo but failed to get to 76.0% fibo at 1819.00. The next descending impulse may fall to break the low at 1123.60 and then reach 50.0% fibo at 1065.00.

Author

RoboForex Team

RoboForex Team is a group of professional financial experts with high experience on financial market, whose main purpose is to provide traders with quality and up-to-date market information.

More from RoboForex Team
Share:

Markets move fast. We move first.

Orange Juice Newsletter brings you expert driven insights - not headlines. Every day on your inbox.

By subscribing you agree to our Terms and conditions.

Editor's Picks

EUR/USD could test 1.1750 amid strengthening bullish bias

EUR/USD remains flat after two days of small losses, trading around 1.1740 during the Asian hours on Thursday. On the daily chart, technical analysis indicates a strengthening of a bullish bias, as the pair continues to trade within an ascending channel pattern.

GBP/USD consolidates above mid-1.3300s as traders await BoE and US CPI report

The GBP/USD pair struggles to capitalize on the overnight bounce from the 1.3310 area, or a one-week low, and oscillates in a narrow band during the Asian session on Thursday. Spot prices currently trade around the 1.3370 region, down less than 0.10% for the day, as traders opt to wait on the sidelines ahead of the key central bank event risk and US consumer inflation data.

Gold declines on profit-taking, USD strength ahead of US CPI release

Gold price edges lower below $4,350 during the Asian trading hours on Thursday. The precious metal retreats from seven-week highs amid some profit-taking and a rebound in the US Dollar (USD). The potential downside for the yellow metal might be limited after the recent US jobs data reinforce market expectations of further interest rate cuts by the US Federal Reserve and drag the USD lower. 

Top Crypto Losers: Pump.fun, SPX6900, Bittensor slide further with double-digit losses

Pump.fun, SPX6900, and Bittensor are leading the losses in the cryptocurrency market over the last 24 hours amid total liquidations of over $500 million. The retail segment alleges institutional manipulation amid an early-morning Bitcoin sell-off routine in the US market.

Monetary policy: Three central banks, three decisions, the same caution

While the Fed eased its monetary policy on 10 December for the third consecutive FOMC meeting, without making any guarantees about future action, the BoE, the ECB and the BoJ are holding their respective meetings this week. 

Crypto Today: Bitcoin, Ethereum, XRP slide further as risk-off sentiment deepens

Bitcoin faces extended pressure as institutional investors reduce their risk exposure. Ethereum’s upside capped at $3,000, weighed down by ETF outflows and bearish signals. XRP slides toward November’s support at $1.82 despite mild ETF inflows.