Fedspeak doesn’t propel markets [Video]
![Fedspeak doesn’t propel markets [Video]](https://editorial.fxstreet.com/images/Markets/Currencies/Majors/DollarIndex/stock-market-analysis-1679764_XtraLarge.jpg)
US Dollar: Dec '21 USD is Up at 93.710.
Energies: Dec '21 Crude is Up at 84.27.
Financials: The Dec '21 30 Year bond is Down 4 ticks and trading at 158.05.
Indices: The Dec '21 S&P 500 emini ES contract is 11 ticks Higher and trading at 4539.50.
Gold: The Dec'21 Gold contract is trading Up at 1800.60. Gold is 43 ticks Higher than its close.
Initial conclusion
This is not a correlated market. The dollar is Up and Crude is Up which is not normal but the 30 year Bond is trading Lower. The Financials should always correlate with the US dollar such that if the dollar is lower then bonds should follow and vice-versa. The S&P is Higher and Crude is trading Higher which is not correlated. Gold is trading Higher which is not correlated with the US dollar trading Up. I tend to believe that Gold has an inverse relationship with the US Dollar as when the US Dollar is down, Gold tends to rise in value and vice-versa. Think of it as a seesaw, when one is up the other should be down. I point this out to you to make you aware that when we don't have a correlated market, it means something is wrong. As traders you need to be aware of this and proceed with your eyes wide open. Currently Asia is trading Mixed with half the exchanges Higher and the other half Lower. All of Europe is trading Mixed as well.
Possible challenges to traders today
-
No Major news to speak of.
-
Lack of Major economic news.
Treasuries
Traders please note that we've changed the Bond instrument from the 30 year (ZB) to the 10 year (ZN). They work exactly the same.
We've elected to switch gears a bit and show correlation between the 10 year bond (ZN) and The S&P futures contract. The S&P contract is the Standard and Poor's and the purpose is to show reverse correlation between the two instruments. Remember it's liken to a seesaw, when up goes up the other should go down and vice versa.
On Friday the ZN made it's move at around 8 AM EST. The ZN hit a Low at around that time and the S&P moved Lower. If you look at the charts below ZN gave a signal at around 8 AM EST and the S&P moved Lower at around the same time. Look at the charts below and you'll see a pattern for both assets. ZN hit a Low at around 8 AM EST and the S&P was moving Lower shortly thereafter. These charts represent the newest version of MultiCharts and I've changed the timeframe to a 15 minute chart to display better. This represented a Long opportunity on the 10 year note, as a trader you could have netted about 20 plus ticks per contract on this trade. Each tick is worth $15.625. Please note: the front month for the ZN is now Dec '21. The S&P contract is now Dec '21 as well. I've changed the format to Renko bars such that it may be more apparent and visible.
Charts Courtesy of MultiCharts built on an AMP platform
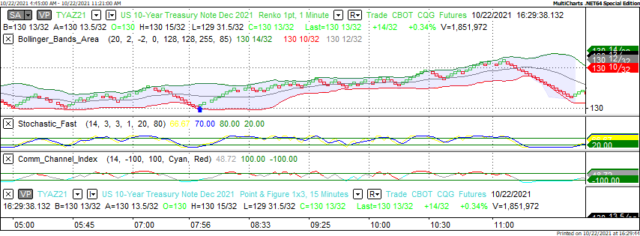
ZN - Dec 2021 - 10/22/21
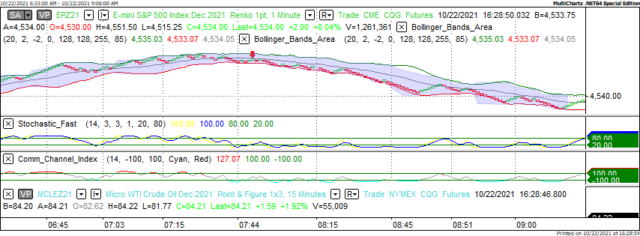
S&P - Dec 2021 - 10/22/21
Bias
On Friday we gave the markets a Mixed bias as we didn't see much in the way of correlation Friday morning. The markets didn't disappoint as the Dow traded 74 points Higher however the S&P and Nasdaq both fell and closed Lower. Today we aren't dealing with a correlated market and our bias is Neutral or Mixed.
Could this change? Of Course. Remember anything can happen in a volatile market.
Commentary
On Friday the Fed Chair Powell spoke and the entire financial world hung on every word. The Fed Chair admitted that inflationary pressures will be here for a while, well into 2022 which was longer than expected. The US now has supply chain issues in terms of unloading and distributing foreign goods throughout the United States and we have a shortage of truck drivers to move these goods. Originally it was thought that the inflation pressures would be temporary at best but the bottleneck of unloading goods at various ports in the US isn't helping. The Fed is still sticking to their target of 2% for inflation but the good news? The Fed doesn't feel that this is the right time or environment to be raising interest rates.
Author

Nick Mastrandrea
Market Tea Leaves


