Fedspeak day, part two

USD: Jun '24 is Down at 104.445.
Energies: Jun '24 Crude is Down at 77.97.
Financials: The June '24 30 Year T-Bond is Up 3 ticks and trading at 117.05.
Indices: The Jun '24 S&P 500 emini ES contract is 9 ticks Higher and trading at 5334.00.
Gold: The Jun'24 Gold contract is trading Down at 2422.60
Initial conclusion
This is not a correlated market. The USD is Down and Crude is Down which is not normal, and the 30 Year T-Bond is trading fractionally Higher. The Financials should always correlate with the US dollar such that if the dollar is Higher, then the bonds should follow and vice-versa. The S&P is Higher and Crude is trading Lower which is correlated. Gold is trading Lower which is not correlated with the US dollar trading Down. I tend to believe that Gold has an inverse relationship with the US Dollar as when the US Dollar is down, Gold tends to rise in value and vice-versa. Think of it as a seesaw, when one is up the other should be down. I point this out to you to make you aware that when we don't have a correlated market, it means something is wrong. As traders you need to be aware of this and proceed with your eyes wide open. All of Asia is trading Lower. All of Europe is trading Lower as well.
Possible challenges to traders
-
FOMC Member Waller Speaks at 9 AM EST. This is Major.
-
FOMC Member Barkin Speaks at 9 AM EST. This is Major.
-
FOMC Member Williams Speaks at 9:05 AM EST. This is Major.
-
FOMC Member Bostic Speaks at 9:10 AM EST. This is Major.
-
FOMC Member Barr Speaks at 11:45 AM EST. This is Major.
Treasuries
Traders, please note that we've changed the Bond instrument from the 10 year (ZN) to the 2 year (ZT). They work exactly the same.
We've elected to switch gears a bit and show correlation between the 2-year Treasury notes (ZT) and the S&P futures contract. The S&P contract is the Standard and Poor's, and the purpose is to show reverse correlation between the two instruments. Remember it's likened to a seesaw, when up goes up the other should go down and vice versa.
Yesterday the ZT migrated Lower at around 7:45 AM EST as the S&P hit a Low at around that time and the ZN migrated Lower. If you look at the charts below the ZN gave a signal at around 9:15 AM and started its Downward slide. Look at the charts below and you'll see a pattern for both assets. S&P moving Higher at around 9:15 AM and the ZN moving Lower at around the same time. These charts represent the newest version of MultiCharts and I've changed the timeframe to a 15-minute chart to display better. This represented a Short opportunity on the 2-year note, as a trader you could have netted about 8 ticks per contract on this trade. Each tick is worth $31.25. Please note: the front month for both the ZN and the S&P are now Jun '24. I've changed the format to filled Candlesticks (not hollow) such that it may be more apparent and visible.
Charts courtesy of MultiCharts built on an AMP platform
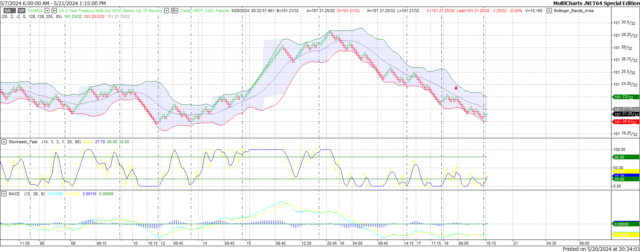
ZN -Jun 2024 - 05/20/24
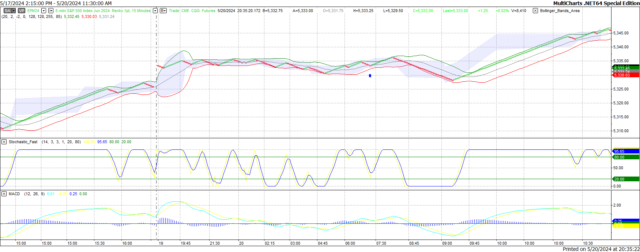
S&P - Jun 2024 - 05/20/24
Bias
Yesterday we gave the markets an Upside bias as Crude and the Bonds started to trade Lower hence teh upside bias. The markets traded mainly Higher as the S&P and Nasdaq both closed Higher. The Dow traded 197 points Lower. Today we aren't dealing with a correlated market and our bias is Neutral or Mixed.
Could this change? Of Course. Remember anything can happen in a volatile market.
Commentary
Well, it seems as though Fedspeak Day didn't help much as the Dow traded nearly 200 points Lower and today we have more of the same as we don't have solid economic news to report. News that could in fact move the markets. So, we will see if the Fed members speaking today will say something to move the markets in the right direction.
Author

Nick Mastrandrea
Market Tea Leaves
Nick Mastrandrea over 20 years experience in trading and formerly held a NASD Series 7. He currently holds a NJ Life, Health and Variable Authority. Nick is a published writer and his work has appeared in Futures Magazine, TraderPlanet and others.


