Fed’s tightening cycle: Bullish or bearish for gold?

This month, the Fed is expected to hike interest rates. Contrary to popular belief, the tightening doesn't have to be adverse for gold. What does history show?
March 2022 – the Fed is supposed to end its quantitative easing and hike the federal funds rate for the first time during recovery from a pandemic crisis. After the liftoff, the Fed will probably also start reducing the size of its mammoth balance sheet and raise interest rates a few more times. Thus, the tightening of monetary policy is slowly becoming a reality. The golden question is: how will the yellow metal behave under these conditions?
Let’s look into the past. The last tightening cycle of 2015-2019 was rather positive for gold prices. The yellow metal rallied in this period from $1,068 to $1,320 (I refer here to monthly averages), gaining about 24%, as the chart below shows.

What’s really important is that gold bottomed out in December 2015, the month of the liftoff. Hence, if we see a replay of this episode, gold should detach from $1,800 and go north, into the heavenly land of bulls. However, in December 2015, real interest rates peaked, while in January 2016, the US dollar found its local top. These factors helped to catapult gold prices a few years ago, but they don’t have to reappear this time.
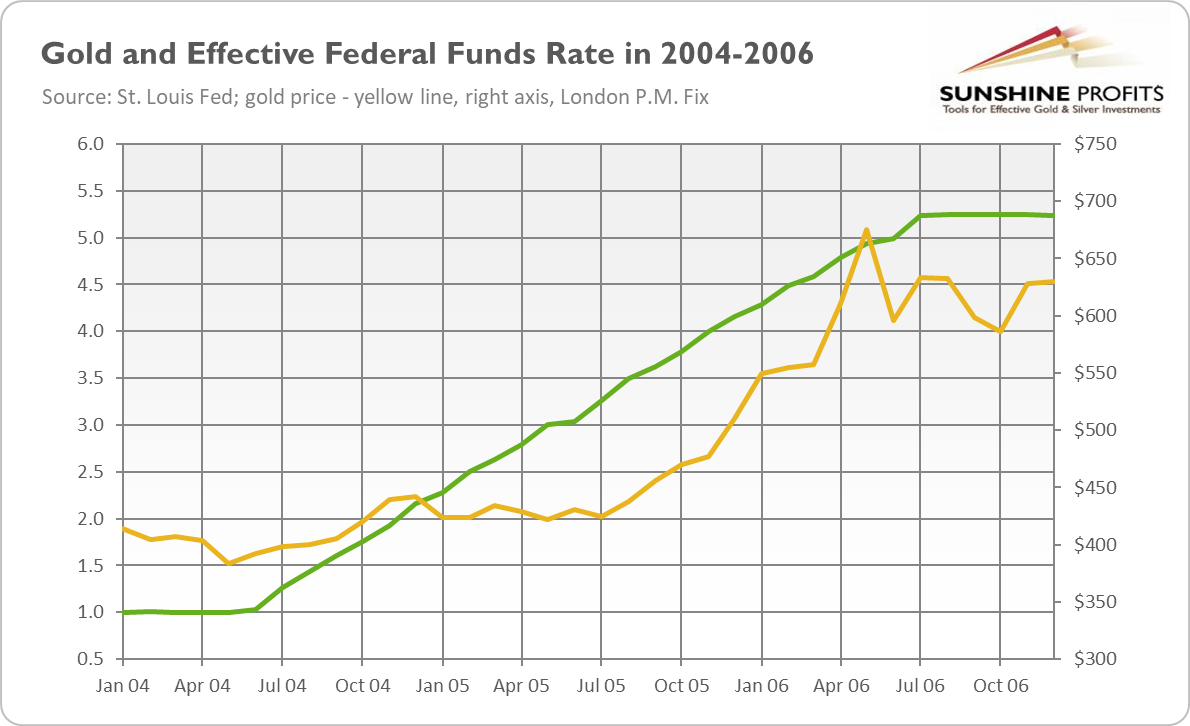
Let’s dig a bit deeper. The earlier tightening cycle occurred between 2004 and 2006, and it was also a great time for gold, despite the fact that the Fed raised interest rates by more than 400 basis points, something unthinkable today. As the chart below shows, the price of the yellow metal (monthly average) soared from $392 to $634, or more than 60%. Just as today, inflation was rising back then, but it was also a time of great weakness in the greenback, a factor that is currently absent.
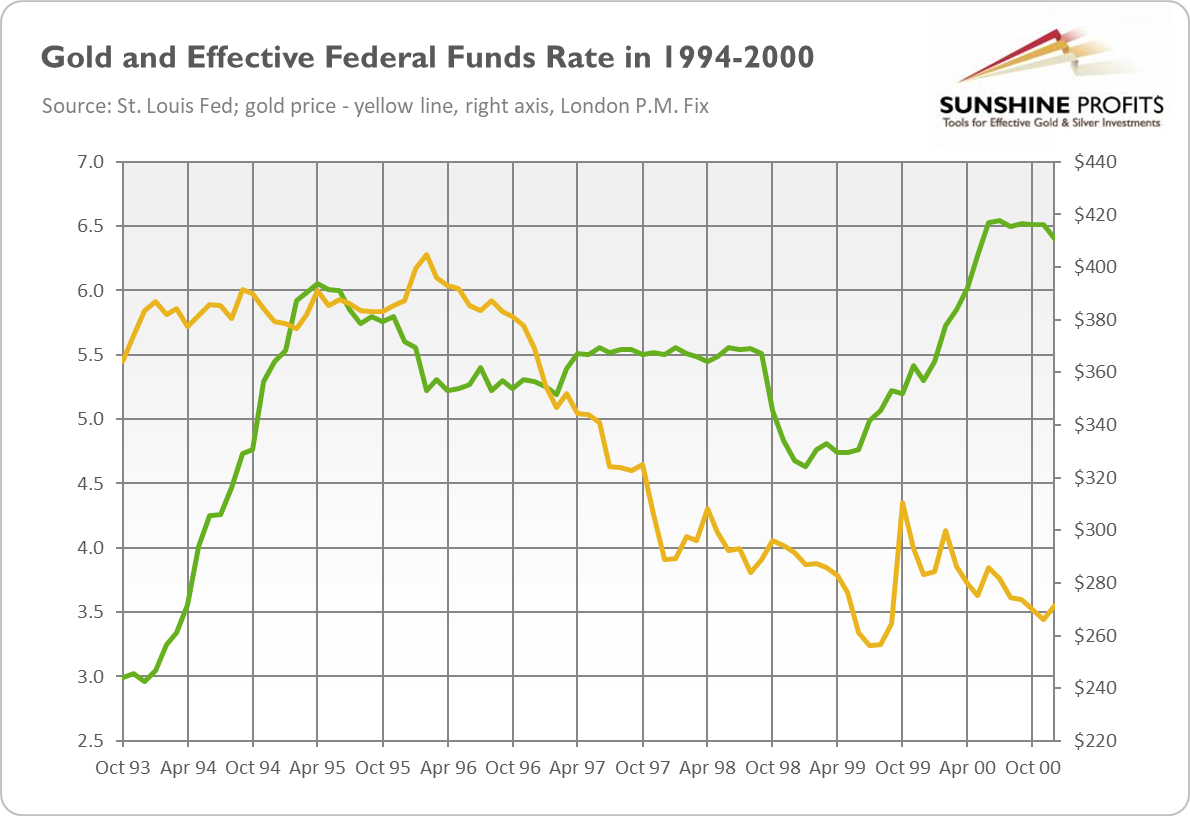
Let’s move even further back into the past. The Fed also raised the federal funds rate in the 1994-1995 and 1999-2000 periods. The chart below shows that these cases were rather neutral for gold prices. In the former, gold was traded sideways, while in the latter, it plunged, rallied, and returned to a decline. Importantly, just as in 2015, the yellow metal bottomed out soon after the liftoff in early 1999.
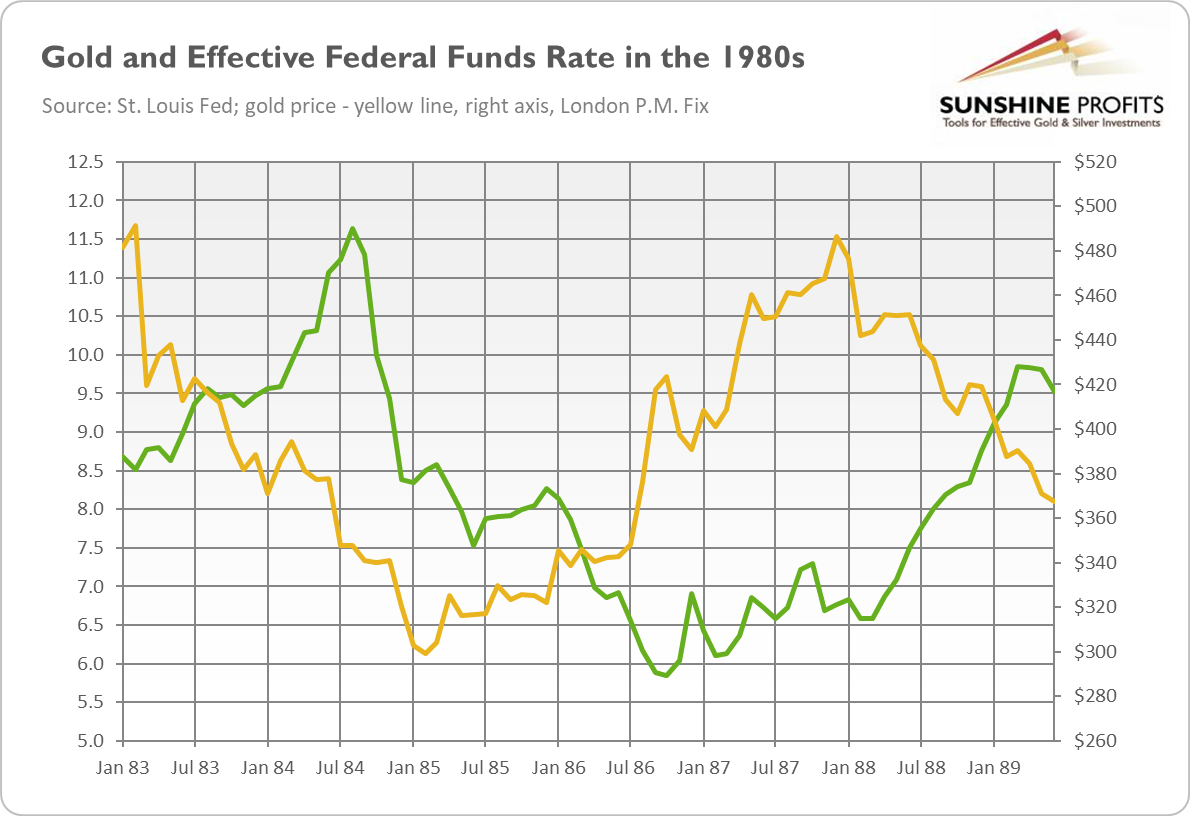
In the 1980s, there were two major tightening cycles – both clearly negative for the yellow metal. In 1983-1984, the price of gold plunged 29% from $491 to $348, despite rising inflation, while in 1988-1989, it dropped another 12%, as you can see in the chart below.
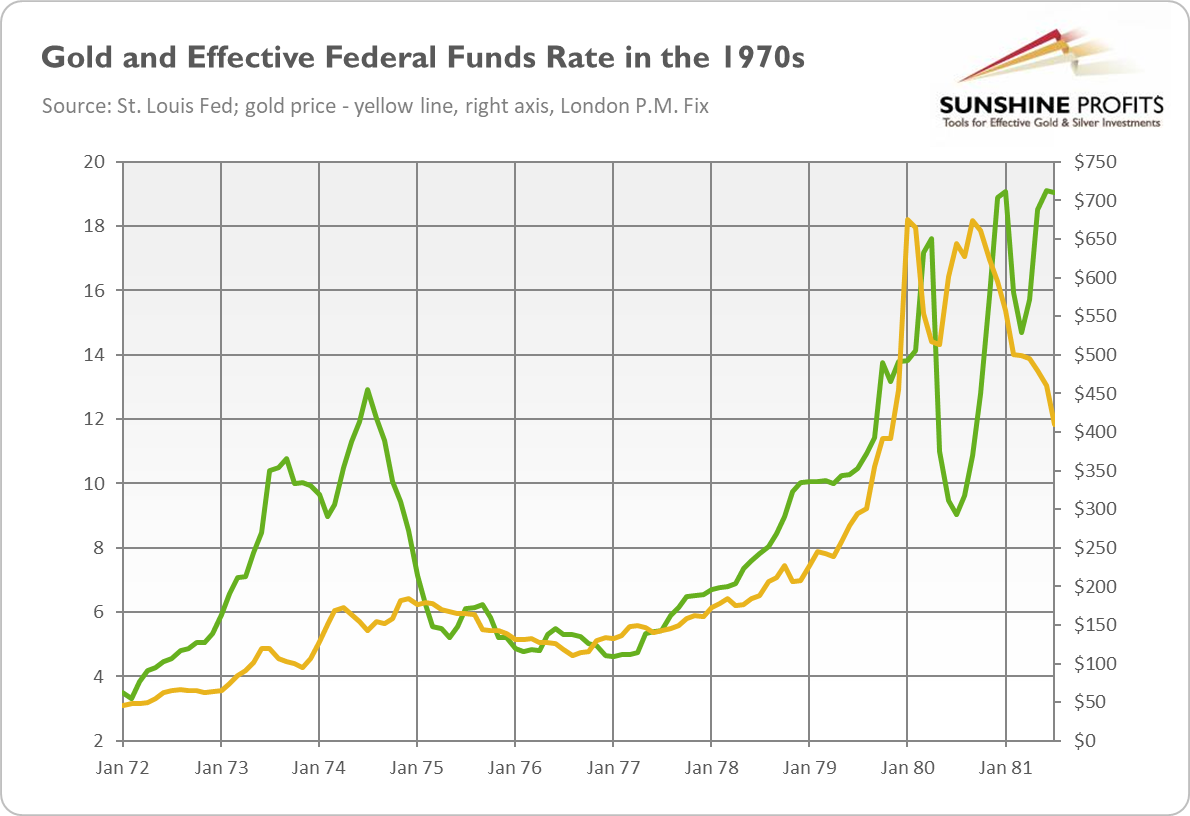
Finally, we have traveled back in time to the Great Stagflation period! In the 1970s, the Fed’s tightening cycles were generally positive for gold, as the chart below shows. In the period from 1972 to 1974, the average monthly price of the yellow metal soared from $48 to $172, or 257%. The tightening of 1977-1980 was an even better episode for gold. Its price skyrocketed from $132 to $675, or 411%. However, monetary tightening in 1980-1981 proved not very favorable , with the yellow metal plunging then to $409.
What are the implications of our historical analysis for the gold market in 2022? First, the Fed’s tightening cycle doesn’t have to be bad for gold. In this report, I’ve examined nine tightening cycles – of which four were bullish, two were neutral, and three were bearish for the gold market. Second, all the negative cases occurred in the 1980s, while the two most recent cycles from the 21st century were positive for gold prices. It bodes well for the 2022 tightening cycle.
Third, the key is, as always, the broader macroeconomic context – namely, what is happening with the US dollar, inflation, and real interest rates. For example, in the 1970s, the Fed was hiking rates amid soaring inflation. However, in March 1980, the CPI annul rate peaked, and a long era of disinflation started. This is why tightening cycles were generally positive in the 1970s, and negative in the 1980s.
Hence, it seems on the surface that the current tightening should be bullish for gold, as it is accompanied by high inflation. However, inflation is expected to peak this year. If this happens, real interest rates could increase even further, creating downward pressure on gold prices. Please remember that the real federal funds rate is at a record low level. If inflation peaks, gold bulls’ only hope will be either a bearish trend in the US dollar (amid global recovery and ECB’s monetary policy tightening) or a dovish shift in market expectations about the path of the interest rates, given that the Fed’s tightening cycle has historically been followed by an economic slowdown or recession.
Want free follow-ups to the above article and details not available to 99%+ investors? Sign up to our free newsletter today!
Want free follow-ups to the above article and details not available to 99%+ investors? Sign up to our free newsletter today!
Author

Arkadiusz Sieroń
Gold Price Forecast
Arkadiusz Sieroń received his Ph.D. in economics in 2016 (his doctoral thesis was about Cantillon effects), and has been an assistant professor at the Institute of Economic Sciences at the University of Wrocław since 2017.


