Fed Will Cause a 2008 Redux
Truth is a rare commodity on Wall Street. You have to sift through tons of dirt to find the golden ore. For example, main stream analysis of the Fed’s current monetary policy claims that it will be able to normalize interest rates with impunity. That assertion could not be further from the truth.
The fact is the Fed has been tightening monetary policy since December of 2013, when it began to taper the asset purchase program known as Quantitative Easing. This is because the flow of bond purchases is much more important than the stock of assets held on the Fed’s balance sheet. The Fed Chairman at the time, Ben Bernanke, started to reduce the amount of bond purchases by $10 billion per month; taking the amount of QE from $85 billion, to 0 by the end of October 2014.
The end of QE meant the Fed would no longer be pushing up MBS and Treasury bond prices (sending yields lower) with its $85 billion per month worth of bids. And that the primary dealers would no longer be flooded with new money supply in the form of excess bank reserves. In other words, the Fed started the economy down the slow path towards deflation.
One of the greatest economic indicators is the steepness of the Treasury yield curve. A steep curve indicates inflation and strong growth; whereas a flat yield curve is indicative of economic stagnation and deflation.
Therefore, the view that the Fed has been in tightening mode for the past three years can be proven by the fact that the spread between the 10 and 2-Year Note yield began to collapse on the very month that the Fed began to Taper QE. That difference was 260 basis points in December 2013, but narrowed all the way down to just 76 basis points by the summer of 2016. Then, after a small recovery to 134 bps—mostly due to the enthusiasm caused by the election of Donald Trump—the spread is quickly retreating back towards 100 bps.
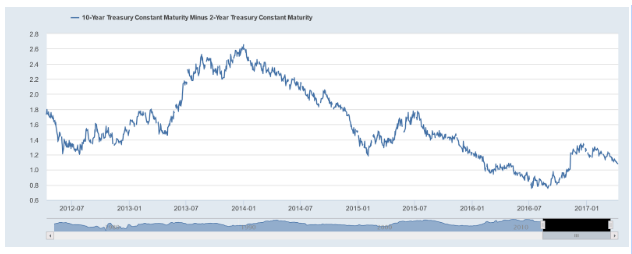
It is no coincidence that the 2-10 spread began to contract concurrently with the Fed’s taper of QE. Tapering is indeed tightening, even though the Fed tends to believe in a stock versus flow analysis. But now, Chair Yellen and the other members of the FOMC have indicated that two or three more rate hikes during this year are a distinct possibility. This is in addition to already increasing the Fed Funds Rate by 25bps in both December of 2016 and March of this year. Even more, the Fed has proposed to cease rolling over its asset holdings; as its $2.4 trillion worth of Treasuries and $1.7 trillion in MBS securities mature. That process is scheduled to begin by the end of 2017.
What this amounts to is a reverse QE program or Quantitative Tightening; where the Fed not only reduces the monetary base but also causes MBS and longer-dated Treasury yields to rise.
However, this tightening is occurring in the context of anemic and slowing growth. No longer is the economy slumping along with the sub-par growth of 2% experienced since 2010. GDP growth expanded by just 1.6% during all of 2016 and is growing at a 0.5% annualized rate in Q1, according to the Atlanta Fed Model.
Therefore, the Fed has most likely already tightened monetary policy enough to throw the economy into a recession. After all, the history of the Fed is marked by one that blows up asset bubbles and then crashes the economy when it removes its accommodation. The yield curve is telling investors that raising the Fed Funds Rate when the March NFP growth was only 98k and Q1 GDP growth has a zero handle, will cause the yield curve to invert and retard the growth rate of money supply to an even greater extent.
This makes perfect sense because raising the overnight interbank lending rate does not increase long-term rates unless growth and inflation are already running hot. Clearly, this is not currently the case.
Once the Fed inverts the curve a brutal recession will be at the door. But our government will not have nearly as much ammunition to fight the economic contraction as it did during the Great Recession circa 2008. This is because the Fed’s balance sheet has increased by $3.7 trillion and the National Debt has doubled to $20 trillion. Hence, our government and central bank are already overleveraged.
Our debt-disabled economy with a record $63 trillion in outstanding obligations (340% of GDP), which was fundamental in blowing up the triumvirate of asset bubbles that are extant in stocks, bonds, and real estate, cannot handle increasing debt service payments. Hence, this next recession will be a very remarkable one indeed. Ms. Yellen and Company may be blind to these dynamics, but investors do not have to be.
Author

Michael Pento
Pento Portfolio Strategies
Mr. Michael Pento is the President of Pento Portfolio Strategies and serves as Senior Market Analyst for Baltimore-based research firm Agora Financial. Pento Portfolio Strategies provides strategic advice and research for institutional clients.


