Fed stands pat

USD: Jun '25 is Up at 99.920.
Energies: Jun '25 Crude is Up at 59.05.
Financials: The Jun '25 30 Year T-Bond is Lower by 13 ticks and trading at 114.31.
Indices: The Jun '25 S&P 500 emini ES contract is 256 ticks Higher and trading at 5716.00.
Gold: The Jun'25 Gold contract is trading Down at 3349.20.
Initial conclusion
This is not a correlated market. The USD is Up and Crude is Up which is not normal, but the 30 Year T-Bond is trading Lower. The Financials should always correlate with the US dollar such that if the dollar is Higher, then the bonds should follow and vice-versa. The S&P is Higher and Crude is trading Higher which is not correlated. Gold is trading Lower which is correlated with the US dollar trading Up. I tend to believe that Gold has an inverse relationship with the US Dollar as when the US Dollar is down, Gold tends to rise in value and vice-versa. Think of it as a seesaw, when one is up the other should be down. I point this out to you to make you aware that when we don't have a correlated market, it means something is wrong. As traders you need to be aware of this and proceed with your eyes wide open. Asia traded Higher except the Aussie and Nikkei exchanges. All of Europe is trading Higher.
Possible challenges to traders
- Unemployment Claims are out at 8:30 AM EST. This is Major.
- Prelim Nonfarm Productivity q/q is out at 8:30 AM EST. This is Major.
- Prelim Unit Labor Costs q/q is out at 8:30 AM EST. This is Major.
- Final Wholesale Inventories m/m is out at 10 AM EST. This is Major.
- Natural Gas Storage is out at 10:30 AM EST. This is Major.
- 30-y Bond Auction starts at 1 PM EST. This is Major.
Traders, please note that we've changed the Bond instrument from the 10 Year (ZN) to the 2 Year (ZT). They work exactly the same.
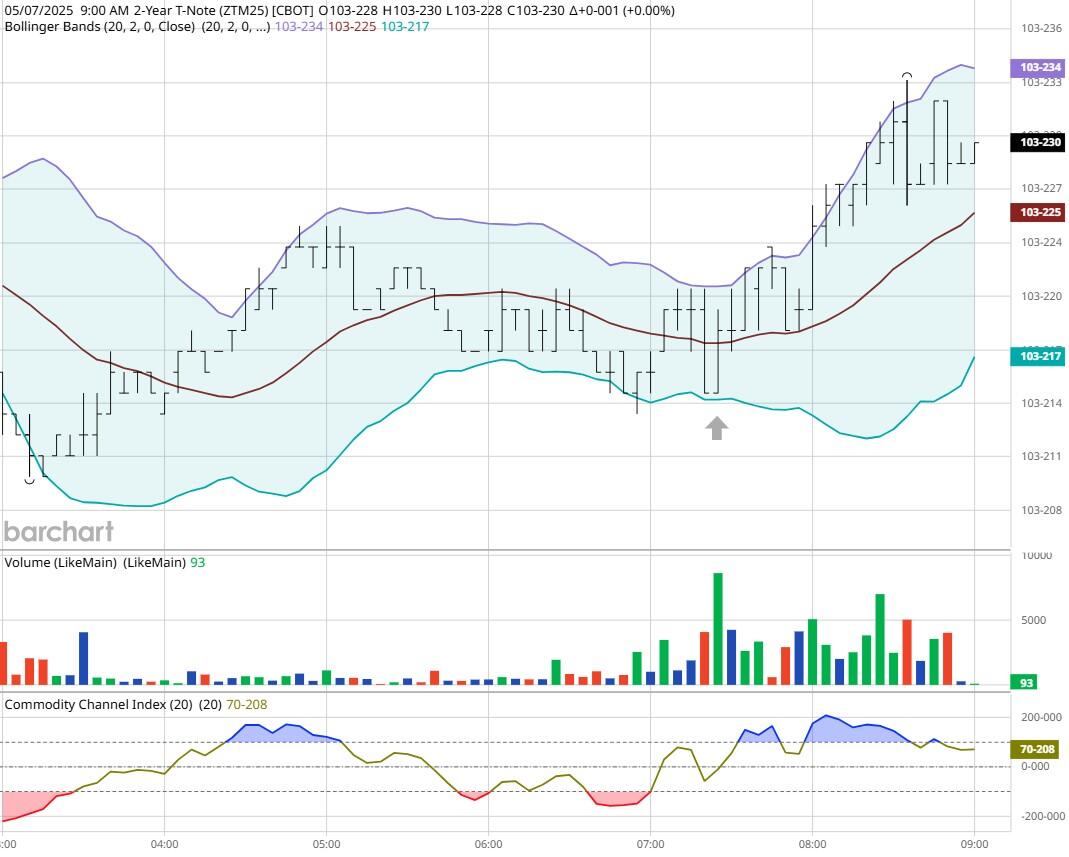
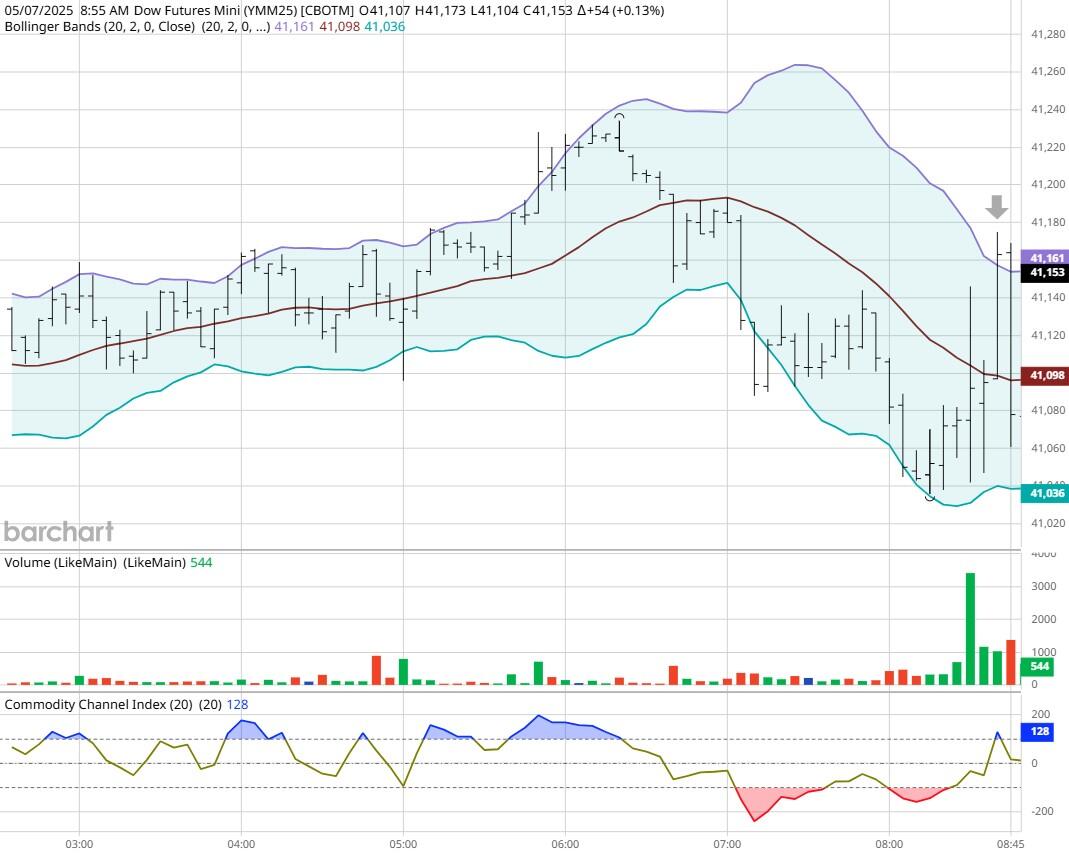
We've elected to switch gears a bit and show correlation between the 2-year Treasury notes (ZT) and the S&P futures contract. The YM contract is the Dow Jones Industrial Average, and the purpose is to show reverse correlation between the two instruments. Remember it's likened to a seesaw, when up goes up the other should go down and vice versa.
Yesterday the ZT climbed Higher at around 8:30 AM EST with no eco news pending. The Dow dropped Lower at the same time. Look at the charts below and you'll see a pattern for both assets. The Dow moved Lower at 8:30 AM EST and the ZT moved Higher at around the same time. These charts represent the newest version of Bar Charts, and I've changed the timeframe to a 15-minute chart to display better. This represented a Long opportunity on the 2-year note, as a trader you could have netted a dozen plus ticks per contract on this trade. Each tick is worth $6.25. Please note: the front month for ZT is now Jun '25 and the Dow is Jun '25 as well. I've changed the format to filled Candlesticks (not hollow) such that it may be more apparent and visible.
Charts courtesy of BarCharts
Dow -Jun 2025 - 5/07/25
ZT - Mar 2025- 5/07/25
Bias
Yesterday we gave the markets a Mixed bias as it was FOMC Day and we always maintain a Neutral bias on that day. The markets veered to the Upside as the Federal Reserve kept rates pat with no change. The Dow closed Higher by 285 points and the other indices closed Higher as well. Today we aren't dealing with a correlated market, and our bias is Neutral or Mixed.
Could this change? Of Course. Remember anything can happen in a volatile market.
Commentary
So, another FOMC Meeting and the Fed decided to keep rates the same, as they are. We kind of thought they would as they claim to need more data before they make a decision. Fed Chair Powell will not be bullied into making a decision by President Donnie 2 Dolls. The President can't fire him, only Congress can do so and only based on proven wrongdoing.
Author

Nick Mastrandrea
Market Tea Leaves


