Fed stands pat
USD: Jun '24 is Up at 105.630.
Energies: Jun '24 Crude is Up at 79.41.
Financials: The June '24 30 Year T-Bond is Down 7 ticks and trading at 114.26.
Indices: The Jun '24 S&P 500 emini ES contract is 144 ticks Higher and trading at 5082.50.
Gold: The Jun'24 Gold contract is trading Down at 2308.90.
Initial conclusion
This is not a correlated market. The USD is Up and Crude is Up which is not normal, but the 30 Year T-Bond is trading Lower. The Financials should always correlate with the US dollar such that if the dollar is Higher, then the bonds should follow and vice-versa. The S&P is Higher and Crude is trading Higher which is not correlated. Gold is trading Lower which is correlated with the US dollar trading Up. I tend to believe that Gold has an inverse relationship with the US Dollar as when the US Dollar is down, Gold tends to rise in value and vice-versa. Think of it as a seesaw, when one is up the other should be down. I point this out to you to make you aware that when we don't have a correlated market, it means something is wrong. As traders you need to be aware of this and proceed with your eyes wide open. Asia is trading Higher with the exception of the Nikkei and Shanghai exchanges. Currently all of Europe is trading Higher with the exception of the Paris exchange.
Possible challenges to traders
-
Unemployment Claims is out at 8:30 AM EST. This is Major.
-
Prelim Nonfarm Productivity q/q is out at 8:30 AM EST. This is Major.
-
Prelim Unit Labor Costs q/q is out at 8:30 AM EST. This is Major.
-
Trade Balance is out at 8:30 AM EST. This is Major.
-
Factory Orders is out at 10 AM EST. This is Major.
-
Natural Gas Storage is out at 10:30 AM EST. This is Major.
Treasuries
Traders, please note that we've changed the Bond instrument from the 30 year (ZB) to the 10 year (ZN). They work exactly the same.
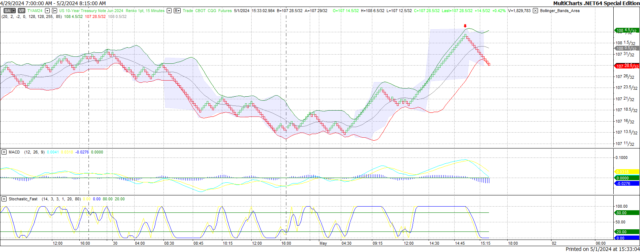
We've elected to switch gears a bit and show correlation between the 10-year bond (ZN) and the S&P futures contract. The S&P contract is the Standard and Poor's, and the purpose is to show reverse correlation between the two instruments. Remember it's likened to a seesaw, when up goes up the other should go down and vice versa.
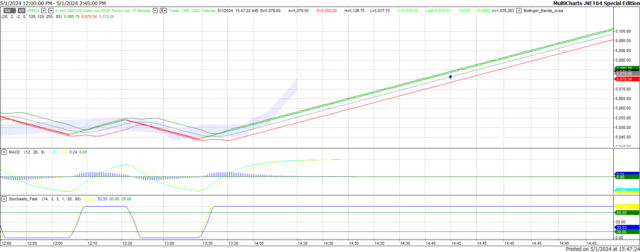
Yesterday the ZN migrated Lower at around 2:45 PM EST as the S&P hit a Low at around that time and the ZN hit a High moving Lower. If you look at the charts below the ZN gave a signal at around 2:45 PM and started its Downward slide. Look at the charts below and you'll see a pattern for both assets. S&P moving Higher at around 2:45 PM and the ZN moving Lower at around the same time. These charts represent the newest version of MultiCharts and I've changed the timeframe to a 15-minute chart to display better. This represented a Short opportunity on the 10-year note, as a trader you could have netted about a dozen ticks per contract on this trade. Each tick is worth $15.625. Please note: the front month for both the ZN and the S&P are now Jun '24. I've changed the format to filled Candlesticks (not hollow) such that it may be more apparent and visible.
Charts courtesy of MultiCharts built on an AMP platform
ZN -Jun 2024 - 05/01/24
S&P - Jun 2024 - 05/01/24
Bias
Yesterday we suggested a Neutral or Mixed day but the markets had other ideas. The Dow advanced 336 points and the other indices advanced as well. Today we aren't dealing with a correlated market and our bias is to the Upside.
Could this change? Of Course. Remember anything can happen in a volatile market.
Commentary
So, another FOMC meeting has come and gone and what did we hear? We heard that the Fed is not ready to cut rates and remains noncommittal in terms of telling us when they might do so. Yet the markets reacted positively to this and I suspect the reason is because they didn't hike rates with inflation still running wild. The price of just about everything has increased and fortunately the Fed did not hike. I fear it would have been disastrous if they did. But we still hear people complain that the Fed should cut rates and they should. Why? Because it will help the economy, particularly the real estate market. What happens when rates go down? Prices go up. So, if prices are rising with a nearly 8% mortgage rate, what will happen if rates get cut? Prices will go up.
Author

Nick Mastrandrea
Market Tea Leaves


