Fed Stands Pat
Good Morning Traders,
As of this writing 4 AM EST, here's what we see:
US Dollar: Dec. USD is Down at 92.270.
Energies: Nov Crude is Down at 50.53.
Financials: The Dec 30 year bond is Up 1 tick and trading at 153.25.
Indices: The Dec S&P 500 emini ES contract is 11 ticks Lower and trading at 2502.50.
Gold: The Dec gold contract is trading Down at 1298.00. Gold is 184 ticks Lower than its close.
Initial Conclusion
This is not a correlated market. The dollar is Down- and Crude is Down- which is not normal but the 30 year Bond is trading Higher. The Financials should always correlate with the US dollar such that if the dollar is lower then bonds should follow and vice-versa. The indices are Lower and Crude is trading Down- which is not correlated. Gold is trading Down- which is not correlated with the US dollar trading Down-. I tend to believe that Gold has an inverse relationship with the US Dollar as when the US Dollar is down, Gold tends to rise in value and vice-versa. Think of it as a seesaw, when one is up the other should be down. I point this out to you to make you aware that when we don't have a correlated market, it means something is wrong. As traders you need to be aware of this and proceed with your eyes wide open.
At this hour all of Asia is trading Lower with the exception of the Nikkei exchange which is fractionally higher at this hour. As of this writing Europe is trading Higher with the exception of the London exchange which is fractionally Lower.
Possible Challenges To Traders Today
-
Unemployment Claims is out at 8:30 AM. This is major.
-
Philly Fed Mfg Index is out at 8:30 AM. This is major.
-
HPI m/m is out at 9 AM EST. This is major.
-
CB Leading Index m/m is out at 10 AM. This is major.
-
Natural Gas Storage is out at 10:30 AM. This is major.
Treasuries
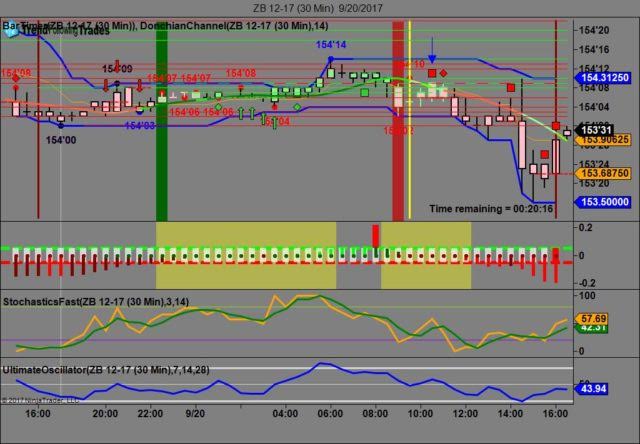
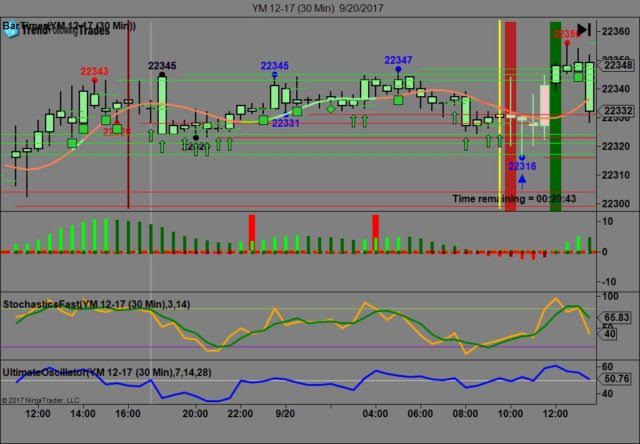
We've elected to switch gears a bit and show correlation between the 30 year bond (ZB) and The YM futures contract. The YM contract is the DJIA and the purpose is to show reverse correlation between the two instruments. Remember it's liken to a seesaw, when up goes up the other should go down and vice versa.
Yesterday the ZB made it's move at around 10:30 AM EST prior to the FOMC announcement. The ZB hit a High at around that time and the YM hit a Low. If you look at the charts below ZB gave a signal at around 10:30 AM EST and the YM was moving Higher at the same time. Look at the charts below and you'll see a pattern for both assets. ZB hit a High at around 10:30 AM and the YM hit a Low. These charts represent the newest version of Trend Following Trades and I've changed the timeframe to a 30 minute chart to display better. This represented a shorting opportunity on the 30 year bond, as a trader you could have netted about 20 plus ticks per contract on this trade. Each tick is worth $31.25. We added a Donchian Channel to the charts to show the signals more clearly. Please note that the front month for the ZB and the YM contract is now December, 2017.
Charts Courtesy of Trend Following Trades built on a NinjaTrader platform
Bias
Yesterday we called for a Neutral bias as it was FOMC Day and those of you who've been with us for any period know that we always maintain a neutral bias on that day. The Dow advanced 42 points, the S&P advanced by 2 and the Nasdaq dropped 5. All in all a mixed or neutral day. Today we will maintain a neutral bias.
Could this change? Of Course. Remember anything can happen in a volatile market.
Commentary
So the Fed decided to stand pat yesterday and leave the FFR at 1.25% but suggested that they will start to unwind their holdings in October. This is not as drastic as one might think. The Fed holds 4.5 Trillion dollars in assets and plane to reduce by only 10 Billion a month. 10 Billion a month is a drop in the bucket as compared to what they hold. At first glance traders might have thought this was drastic as the market dropped initially after 2 PM EST but quickly regained its composure and closed higher. The Fed still left the door open for one more rate hike in 2017 and our guess is this might happen in December, but time will tell. It is good that the Fed didn't declare another rate hike as each time they do so it puts a dent in consumer spending and 70% of the US economy is based upon consumer spending.
Author

Nick Mastrandrea
Market Tea Leaves


