Fed speak propels markets [Video]
![Fed speak propels markets [Video]](https://editorial.fxstreet.com/images/Macroeconomics/CentralBanks/FED/iStock-1162461465_XtraLarge.jpg)
US Dollar: Sept USD is Up at 97.385.
Energies: Aug'20 Crude is Up at 40.36.
Financials: The Sept'20 30 year bond is Down 22 ticks and trading at 177.28.
Indices: The Sept S&P 500 emini ES contract is 37 ticks Lower and trading at 3081.00.
Gold: The Aug'20 Gold contract is trading Up at 1806.01. Gold is 56 ticks Higher than its close.
Initial Conclusion
This is not a correlated market. The dollar is Up+ and Crude is Up+ which is not normal and the 30 year Bond is trading Lower. The Financials should always correlate with the US dollar such that if the dollar is lower then bonds should follow and vice-versa. The S&P is Lower and Crude is trading Higher which is correlated. Gold is trading Higher which is not correlated with the US dollar trading Up. I tend to believe that Gold has an inverse relationship with the US Dollar as when the US Dollar is down, Gold tends to rise in value and vice-versa. Think of it as a seesaw, when one is up the other should be down. I point this out to you to make you aware that when we don't have a correlated market, it means something is wrong. As traders you need to be aware of this and proceed with your eyes wide open.
At this time Asia is trading mainly Higher with the exception of the Nikkei exchange which is Lower at this time. Currently Europe is trading Mixed with half the exchanges Higher and the other half Lower.
Possible Challenges To Traders Today:
-
Challenger Job Cuts is out at 7:30 AM EST. This is Major.
-
ADP Non-Farm Employment Change is out at 8:15 AM EST.
-
This is Major. Final Manufacturing PMI is out at 9:45 AM EST.
-
This is Major. ISM Manufacturing PMI is out at 10 AM EST. This is Major.
-
Construction Spending is out at 10 AM EST. This is Major.
-
ISM Manufacturing Prices is out at 10 AM EST. This is Major.
-
Wards Vehicle Sales by brand - All Day. This is Major.
-
Crude Oil Inventories is out at 10:30 AM EST. This is Major.
-
FOMC Meeting Minutes is out at 2 PM EST. This is Major.
Treasuries
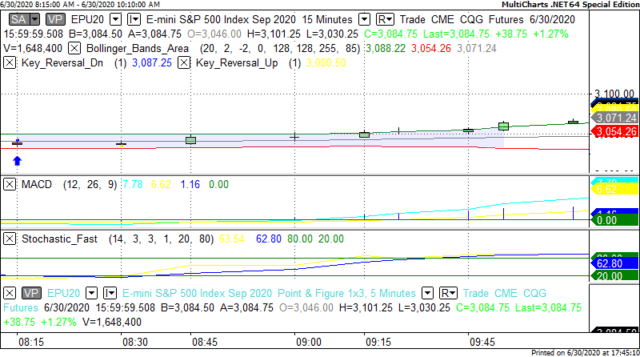
We've elected to switch gears a bit and show correlation between the 30 year bond (ZB) and The S&P futures contract. The S&P contract is the Standard and Poor's and the purpose is to show reverse correlation between the two instruments. Remember it's liken to a seesaw, when up goes up the other should go down and vice versa.
Yesterday the ZB made it's move at around 8 AM EST. The ZB hit a High at around that time and the S&P moved Higher. If you look at the charts below ZB gave a signal at around 8 AM EST and the S&P moved Higher at around the same time. Look at the charts below and you'll see a pattern for both assets. ZB hit a High at around 8 AM EST and the S&P was moving Lower shortly thereafter. These charts represent the newest version of MultiCharts and I've changed the timeframe to a 15 minute chart to display better. This represented a Shorting opportunity on the 30 year bond, as a trader you could have netted about 30 plus ticks per contract on this trade. Each tick is worth $31.25. Please note: the front month for the ZB is now Sept '20. The S&P contract has been changed to Sept '20. I've changed the format to Renko bars such that it may be more apparent and visible.
Charts Courtesy of MultiCharts built on an AMP platform
Bias
Yesterday we gave the markets a Downside bias as Gold, the Bonds and the USD were all trading Higher yesterday morning and this is usually indicative of a Downside day. The markets had other ideas as the Dow closed 217 points Higher and the other indices traded Higher as well. Today we aren't dealing with a correlated market and our bias is Neutral.
Could this change? Of Course. Remember anything can happen in a volatile market.
Commentary
Yesterday we had 4 FOMC members speaking as well as Treasury Secretary Mnuchin. They all said the economy has a long way to go to get to normal but was making improvements and this served to propel the markets forward as the Dow closed 217 points Higher, the S&P 47 points Higher and the Nasdaq 185 points Higher. Whereas we gave the markets a Downside bias, it must be remembered that each and every day we also state "this can change" and often does. Yesterday was a good case in point. The markets were geared to go downward but rose based on comments from these individuals. Today we have 7 economic news, all of which are major.
Author

Nick Mastrandrea
Market Tea Leaves


