Fed speak day
USD: Jun '24 is Up at 104.435.
Energies: Jun '24 Crude is Down at 79.19.
Financials: The June '24 30 Year T-Bond is Up 1 tick and trading at 117.11.
Indices: The Jun '24 S&P 500 emini ES contract is 38 ticks Higher and trading at 5336.75.
Gold: The Jun'24 Gold contract is trading Up at 2427.60
Initial conclusion
This is not a correlated market. The USD is Up and Crude is Down which is normal, and the 30 Year T-Bond is trading fractionally Higher. The Financials should always correlate with the US dollar such that if the dollar is Higher, then the bonds should follow and vice-versa. The S&P is Higher and Crude is trading Lower which is correlated. Gold is trading Higher which is not correlated with the US dollar trading Up. I tend to believe that Gold has an inverse relationship with the US Dollar as when the US Dollar is down, Gold tends to rise in value and vice-versa. Think of it as a seesaw, when one is up the other should be down. I point this out to you to make you aware that when we don't have a correlated market, it means something is wrong. As traders you need to be aware of this and proceed with your eyes wide open. All of Asia is trading Higher. All of Europe is trading mainly Higher with the exception of the Milan exchange.
Possible challenges to traders
-
FOMC Member Bostic Speaks at 7:30 AM EST. This is Major.
-
FOMC Member Bostic Speaks at 8:45 AM EST. This is Major.
-
FOMC Member Waller Speaks at 9 AM EST. This is Major.
-
FOMC Member Barr Speaks at 9 AM EST. This is Major.
-
FOMC Member Jefferson Speaks at 10:30 AM EST. This is Major.
-
FOMC Member Mester Speaks at 2 PM EST. This is Major.
Treasuries
Traders, please note that we've changed the Bond instrument from the 10 year (ZN) to the 2 year (ZT). They work exactly the same.
We've elected to switch gears a bit and show correlation between the 10-year Treasury notes (ZN) and the S&P futures contract. The S&P contract is the Standard and Poor's, and the purpose is to show reverse correlation between the two instruments. Remember it's likened to a seesaw, when up goes up the other should go down and vice versa.
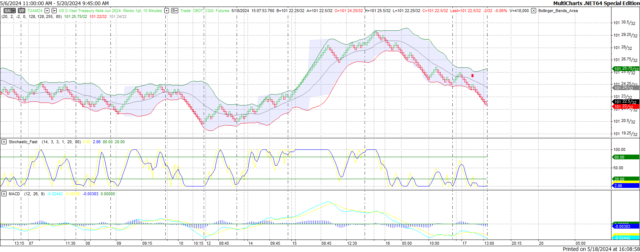
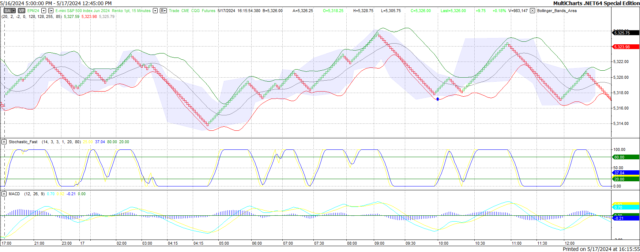
On Friday the ZN migrated Lower at around 10 AM EST as the S&P hit a Low at around that time and the ZN migrated Lower. If you look at the charts below the ZN gave a signal at around 9:15 AM and started its Downward slide. Look at the charts below and you'll see a pattern for both assets. S&P moving Higher at around 9:15 AM and the ZN moving Lower at around the same time. These charts represent the newest version of MultiCharts and I've changed the timeframe to a 15-minute chart to display better. This represented a Short opportunity on the 2-year note, as a trader you could have netted about 8 ticks per contract on this trade. Each tick is worth $31.25. Please note: the front month for both the ZN and the S&P are now Jun '24. I've changed the format to filled Candlesticks (not hollow) such that it may be more apparent and visible.
Charts courtesy of MultiCharts built on an AMP platform
ZN -Jun 2024 - 05/17/24
S&P - Jun 2024 - 05/17/24
Bias
On Friday we gave the markets a Downside bias as the USD, Crude and Gold were all trading Higher Friday morning and that usually represents a Downside Day. The markets had other ideas as the Dow and S&P both closed Higher; however, the Nasdaq did close Lower. Today we aren't dealing with a correlated market and our bias is to the Upside.
Could this change? Of Course. Remember anything can happen in a volatile market.
Commentary
We entitled this edition as Fed Speak Day because the only economic news that we have today is 5 different FOMC members speaking at 6 different times today. We have one member speaking twice. There is no real economic news to drive the markets in one direction or another. We gave the markets a downside bias on Friday as it was in fact correlated in that direction however as we often say "this too can change" and thats what happened on Friday. Will we see the same today? Only time will tell.
Author

Nick Mastrandrea
Market Tea Leaves


