Fed Minutes = Upside Day
Good Morning Traders,
As of this writing 4:20 AM EST, here’s what we see:
US Dollar: Dec. USD is Down at 92.760.
Energies: Nov Crude is Down at 50.96.
Financials: The Dec 30 year bond is Up 8 ticks and trading at 152.26.
Indices: The Dec S&P 500 emini ES contract is 12 ticks Lower and trading at 2550.00.
Gold: The Dec gold contract is trading Up at 1298.40. Gold is 94 ticks Higher than its close.
Initial Conclusion
This is not a correlated market. The dollar is Down- and Crude is Down- which is not normal but the 30 year Bond is trading Higher. The Financials should always correlate with the US dollar such that if the dollar is lower then bonds should follow and vice-versa. The indices are Higher and Crude is trading Down- which is correlated. Gold is trading Up which is correlated with the US dollar trading Down-. I tend to believe that Gold has an inverse relationship with the US Dollar as when the US Dollar is down, Gold tends to rise in value and vice-versa. Think of it as a seesaw, when one is up the other should be down. I point this out to you to make you aware that when we don’t have a correlated market, it means something is wrong. As traders you need to be aware of this and proceed with your eyes wide open.
At this hour Asia is trading mainly Higher with the exception of the Shanghai exchange which is trading fractionally Lower. As of this writing all of Europe is trading Lower.
Possible Challenges To Traders Today
PPI is out at 8:30 AM EST. This is major.
Core PPI is out at 8:30 AM EST. This is major.
Unemployment Claims are out at 8:30 AM. This is major.
FOMC Member Brainard Speaks at 10:30 AM. This is major.
FOMC Member Powell Speaks at 10:30 AM. This is major.
Natural Gas Storage is out at 10:30 AM EST. This is major.
Crude Oil Inventories is out at 11 AM EST. This is major.
30-y Bond Auction starts at 1 PM EST. This is major.
Federal Budget Balance is out at 3 PM EST. This is major.
Treasuries
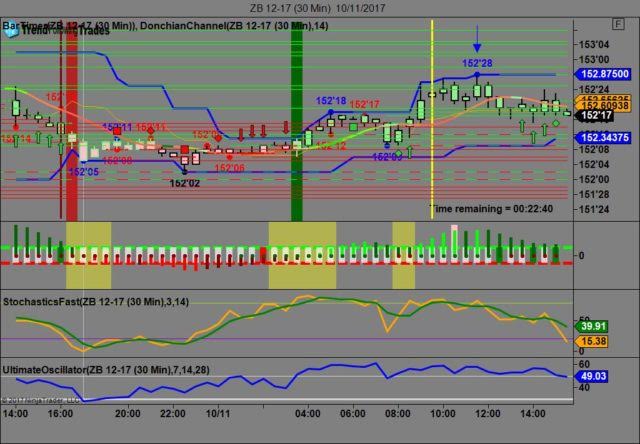
We’ve elected to switch gears a bit and show correlation between the 30 year bond (ZB) and The YM futures contract. The YM contract is the DJIA and the purpose is to show reverse correlation between the two instruments. Remember it’s liken to a seesaw, when up goes up the other should go down and vice versa.
Yesterday the ZB made it’s move at around 11:30 AM EST. The ZB hit a High at around that time and the YM hit a Low. If you look at the charts below ZB gave a signal at around 11:30 AM EST and the YM was moving Higher at the same time. Look at the charts below and you’ll see a pattern for both assets. ZB hit a High at around 11:30 AM and the YM hit a Low. These charts represent the newest version of Trend Following Trades and I’ve changed the timeframe to a 30 minute chart to display better. This represented a Shorting opportunity on the 30 year bond, as a trader you could have netted about a dozen ticks per contract on this trade. Each tick is worth $31.25. We added a Donchian Channel to the charts to show the signals more clearly. Please note that the front month for the ZB and the YM contract is now December, 2017.
Charts Courtesy of Trend Following Trades built on a NinjaTrader platfor.

Bias
Yesterday our bias was Neutral as the USD, Bonds and Gold were all trading Lower but the indices didn’t respond to the direction as they all pointed lower yesterday morning. The Dow gained 42 points and the other indices gained ground as well. Today we aren’t dealing with a correlated market and our bias is to the downside.
Could this change? Of Course. Remember anything can happen in a volatile market.
Commentary
Yesterday the Fed Meeting Minutes came out and guess what? It doesn’t appear as though a rate hike is baked in the cake, so to speak as inflation is nowhere in sight and the Fed will have to readjust it’s criteria for a rate hike. Historically speaking the Fed has always stood by a 3% threshold for inflation in conjunction with a rate hike and that isn’t happening. It is quite possible that no rate hike will be forthcoming and that is welcome news for both consumer spending and the Holiday Shopping Season. Today we have about 9 economic reports, most of which are major and proven market movers.
Author

Nick Mastrandrea
Market Tea Leaves


