Fed drags down markets
USD: Sep '23 is Up at 105.310.
Energies: Oct '23 Crude is Up at 90.58.
Financials: The Dec '23 30 Year T-Bond is Down 7 ticks and trading at 116.02.
Indices: The Dec '23 S&P 500 emini ES contract is 36 ticks Higher and trading at 4381.00.
Gold: The Dec'23 Gold contract is trading Up at 1945.50.
Initial conclusion
This is not a correlated market. The USD is Up and Crude is Up which is not normal, but the 30 Year T-Bond is trading Lower. The Financials should always correlate with the US dollar such that if the dollar is Higher, then the bonds should follow and vice-versa. The S&P is Higher, and Crude is trading Higher which is not correlated. Gold is trading Higher which is correlated with the US dollar trading Down. I tend to believe that Gold has an inverse relationship with the US Dollar as when the US Dollar is down, Gold tends to rise in value and vice-versa. Think of it as a seesaw, when one is up the other should be down. I point this out to you to make you aware that when we don't have a correlated market, it means something is wrong. As traders you need to be aware of this and proceed with your eyes wide open. Asia is trading Mixed with half the exchanges Higher and the other half Lower. Currently all of Europe is trading Lower with the exception of the London exchange.
Possible challenges to traders
-
FOMC Member Cook Speaks at 8:50 AM EST. This is Major.
-
Flash Manufacturing PMI is out at 9:45 AM EST. This is Major.
-
Flash Services PMI is out at 9:45 AM EST. This is Major.
-
FOMC Member Kashkari Speaks at 1 PM EST. This is Major.
Treasuries
Traders, please note that we've changed the Bond instrument from the 30 year (ZB) to the 10 year (ZN). They work exactly the same.
We've elected to switch gears a bit and show correlation between the 10-year bond (ZN) and the S&P futures contract. The S&P contract is the Standard and Poor's, and the purpose is to show reverse correlation between the two instruments. Remember it's likened to a seesaw, when up goes up the other should go down and vice versa.
Yesterday the ZN migrated Higher at around 8:45 AM EST as the S&P hit a High at around the same time. If you look at the charts below the S&P gave a signal at around 8:45 AM and the ZN started its Upward ascend. Look at the charts below and you'll see a pattern for both assets. S&P hit a High at around 8:45 AM and migrated Lower. These charts represent the newest version of MultiCharts and I've changed the timeframe to a 15-minute chart to display better. This represented a Long opportunity on the 10-year note, as a trader you could have netted about 20 plus ticks per contract on this trade. Each tick is worth $15.625. Please note: the front month for the ZN is now Dec '23. The S&P contract is now Dec' 23. I've changed the format to filled Candlesticks (not hollow) such that it may be more apparent and visible.
Charts courtesy of MultiCharts built on an AMP platform
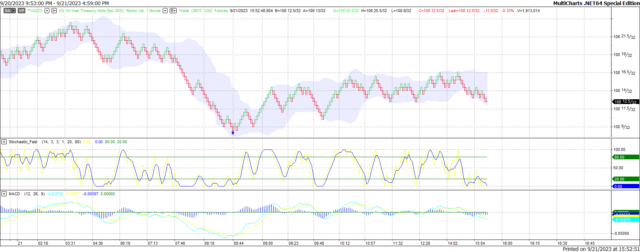
ZN - Dec 2023 - 9/21/23
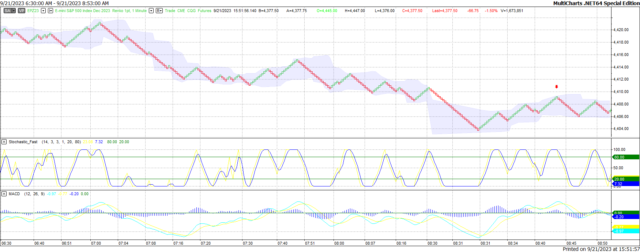
S&P - Dec 2023 - 9/21/23
Bias
Yesterday, we gave the markets a Neutral bias as we didn't see much in the way of Market Correlation Thursday morning. The indices closed Lower as the Dow dropped 370 points and the other indices ended the session Lower as well. Today we aren't dealing with a correlated market and our bias is to the Upside.
Could this change? Of Course. Remember anything can happen in a volatile market.
Commentary
Well, it seems that yesterday was a continuation of Wednesday as the markets did not like the Fed decision. I think what bothers most traders is the fact that the Fed is leaving open the prospect and possibility of an additional rate hike in 2023, just in time for the Christmas Holiday spending season. This clearly was not well thought out. Yesterday the only economic news that fared well was Unemployment Claims, other than that everything else came in Lower than expected and no doubt that didn't help the markets. Today we have Flash Manufacturing PMI and Flas Services. Will this help propel the markets? Only time will tell...
Author

Nick Mastrandrea
Market Tea Leaves


