Fed Doesn’t Hike
US Dollar: Dec. USD is Up at 96.665.
Energies: Dec '18 Crude is Down at 60.22.
Financials: The Dec 30 year bond is Up 15 ticks and trading at 137.21.
Indices: The Dec S&P 500 emini ES contract is 58 ticks Lower and trading at 2794.50.
Gold: The Dec Gold contract is trading Down at 1222.10. Gold is 30 ticks Lower than its close.
Initial Conclusion
This is not a correlated market. The dollar is Up+ and Crude is Down- which is normal and the 30 year Bond is trading Higher. The Financials should always correlate with the US dollar such that if the dollar is lower then bonds should follow and vice-versa. The S&P is Lower and Crude is trading Lower which is not correlated. Gold is trading Down- which is correlated with the US dollar trading Higher. I tend to believe that Gold has an inverse relationship with the US Dollar as when the US Dollar is down, Gold tends to rise in value and vice-versa. Think of it as a seesaw, when one is up the other should be down. I point this out to you to make you aware that when we don't have a correlated market, it means something is wrong. As traders you need to be aware of this and proceed with your eyes wide open.
At this hour all of Asia is trading Lower with many exchanges trading in negative triple digit territory.. Currently all of Europe is trading Lower as well.
Possible Challenges To Traders Today
-
PPI m/m is out at 8:30 AM EST. This is major.
-
Core PPI is out at 8:30 AM EST. This is major.
-
Final Wholesale Inventories is out at 9 AM EST. This is major.
-
FOMC Member Quarles Speaks at 9:05 AM EST. This is major.
-
Prelim UoM Consumer Sentiment is out at 10 AM EST. This is major.
-
Prelim UoM Inflation Expectations is out at 10 AM EST. This is major.
Treasuries
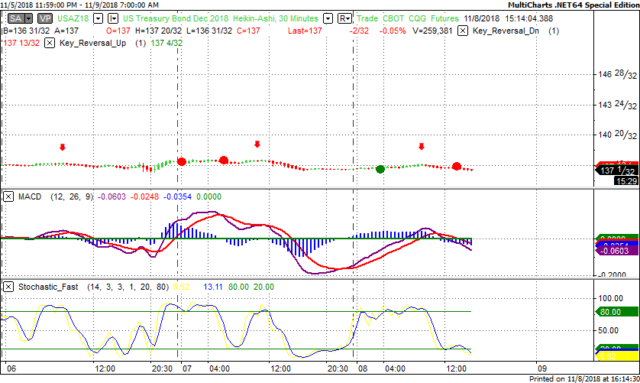
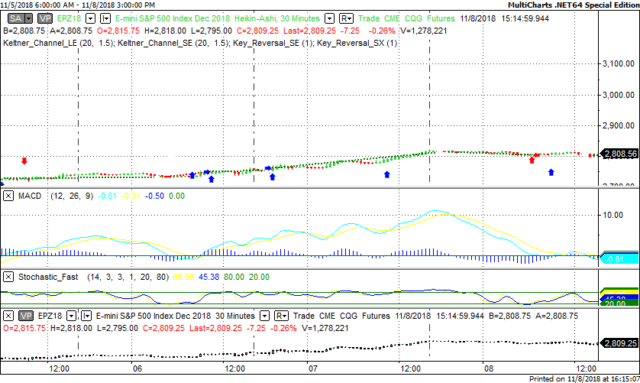
We've elected to switch gears a bit and show correlation between the 30 year bond (ZB) and The YM futures contract. The YM contract is the DJIA and the purpose is to show reverse correlation between the two instruments. Remember it's liken to a seesaw, when up goes up the other should go down and vice versa.
Yesterday the ZB made it's move at around 9 AM EST. The ZB hit a High at around that time and the YM hit a Low. If you look at the charts below ZB gave a signal at around 9 AM EST and the YM was moving Higher at the same time. Look at the charts below and you'll see a pattern for both assets. ZB hit a High at around 9 AM and the YM was moving Higher at the same time. These charts represent the newest version of MultiCharts and I've changed the timeframe to a 30 minute chart to display better. This represented a Shorting opportunity on the 30 year bond, as a trader you could have netted about 20 ticks per contract on this trade. Each tick is worth $31.25.
Charts Courtesy of MultiCharts built on an AMP platform.
Bias
Yesterday we gave the markets a Neutral bias given that it was FOMC Day. The markets finished Mixed with the Dow gaining 11 points but the other indices closed Lower. All in all a mixed or neutral day. Today we aren't dealing with a correlated market and our bias is to the Downside.
Could this change? Of Course. Remember anything can happen in a volatile market.
Commentary
As expected the Federal Reserve didn't raise the Overnight or FFR rate however the markets finished Mixed with the Dow gaining slightly but the other indices closed lower. The reason we suspect this occurred is because the markets gaining dramatically on Wednesday's session; so it's only prudent that traders would want to take some money off the table and apparently they did. Today we have PPI and the University of Michigan's numbers which are always major and proven market movers.
Author

Nick Mastrandrea
Market Tea Leaves


