Falling Treasury yields driving a dollar correction
Market Overview
The outlook for the dollar continues to be driven by Treasury yields and with the yields dropping back the dollar is coming under corrective pressure. With the 10 year Treasury yield falling back to 2.40% (which is the lowest since 9th December) the US Trade Weighted Dollar Index has also fallen away and is testing the support of the late December low at 101.90. A closing breach of this level would confirm the dollar having become corrective. This move on Treasury yields is not being driven by the FOMC minutes, which actually showed a concern that expansive fiscal policy might drive a need for steeper tightening. This is seen as a clear nod towards President-elect Trump, although he was not mentioned by name. Equities tend to struggle during tighter monetary policy and there is a mildly lower move seen in Europe today.

Wall Street did though manage to edge higher with the S&P 500 up by 0.5% at 2271, whilst the Nikkei was off by 0.4% on a stronger yen. The early European moves are also being seen as cautious. In forex the dollar is weaker against all the majors, with the yen the standout performer. Gold and silver are also benefitting from the dollar correction, both over 1% higher, whilst oil is marginally lower, so far unable to continue yesterday’s rebound.
The services PMIs for the UK and US will be the key focus, with UK Services PMI at 0930GMT expected to drop back slightly to 54.8 (from 55.2) however with the big upside surprises for the UK manufacturing and construction sectors in recent days, hopes will be high for a positive surprise in the service sector that dominates the UK economy for around 80% of output. The ISM Non-Manufacturing is at 1500GMT and is expected to dip slightly to 56.6 (from 57.2). US employment is another focus today with the ADP employment change at 1315GMT which is forecast to drop back to 171,000 (from 216,000) which some people see as a harbinger for Friday’s payrolls, whilst the US weekly jobless claims at 1330GMT are expected to stay around recent levels at 262,000. The EIA crude oil inventories are at 1600GMT which is expected to fall by 1.8m barrels.
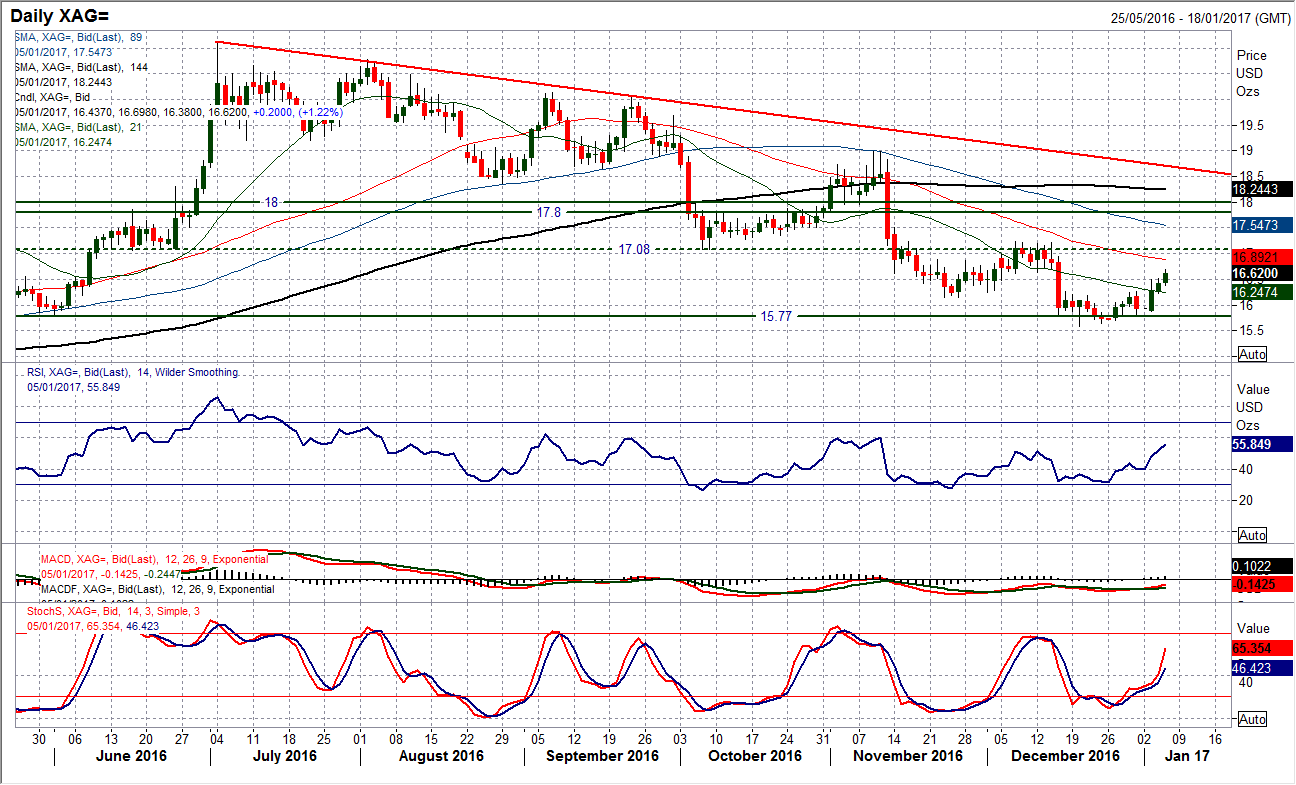
Chart of the Day – Silver
The near term move against the dollar is also showing through in a pick-up in the silver price. Tuesday’s strong bull candle was continued yesterday with further gains and the near term outlook has certainly started to improve. Momentum indicators are recovering with the Stochastics rising and the RSI back above 50. However this still has a look of a bear market rally to it. The big barrier to gains overhead remains around the $17.08/$17.24 resistance and whilst the near term outlook may have some upside potential, the bears could easily be biding their time for the next chance to sell. The price has made a series of key lower highs in the past 7 months, whilst the RSI has continually failed between 50/60 in the past 5 months. The hourly chart shows the upside break above $16.25 opens a recovery towards $16.70/$16.90 today (which is already close), with resistance around $16.62 having also been breahed. Support is around the breakout at $16.12/$16.25 before $15.80 and the key low at $15.59.
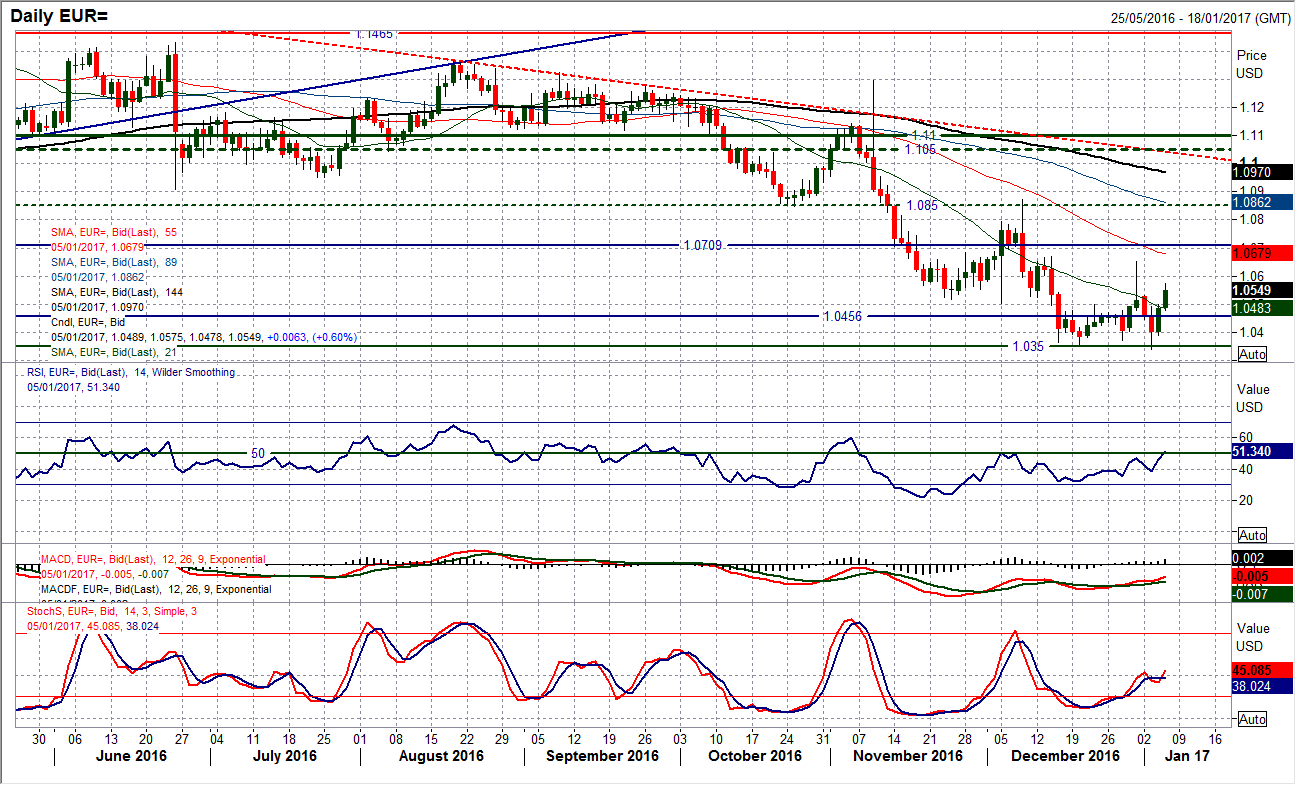
With the US dollar appearing to move into correction mode for the near term, there has been a rally on EUR/USD. The bull candle formation yesterday has been followed by further early gains today which have taken the market above the resistance band $1.0500/$1.0525. The bulls will now be looking to achieve a closing break above this previous resistance which would be a three week closing high. This comes with the RSI looking to push back above 50 and the Stochastics ticking higher again. I do though continue to see this as a near term rally and would be looking to ultimately use this as a chance for medium term shorts. For several months the rallies have failed between 50/60 on RSI and I do not see any longevity in the upside. The next resistance comes in the band $1.0665/$1.0710. The hourly chart shows $1.0590 is also a nearer term resistance.
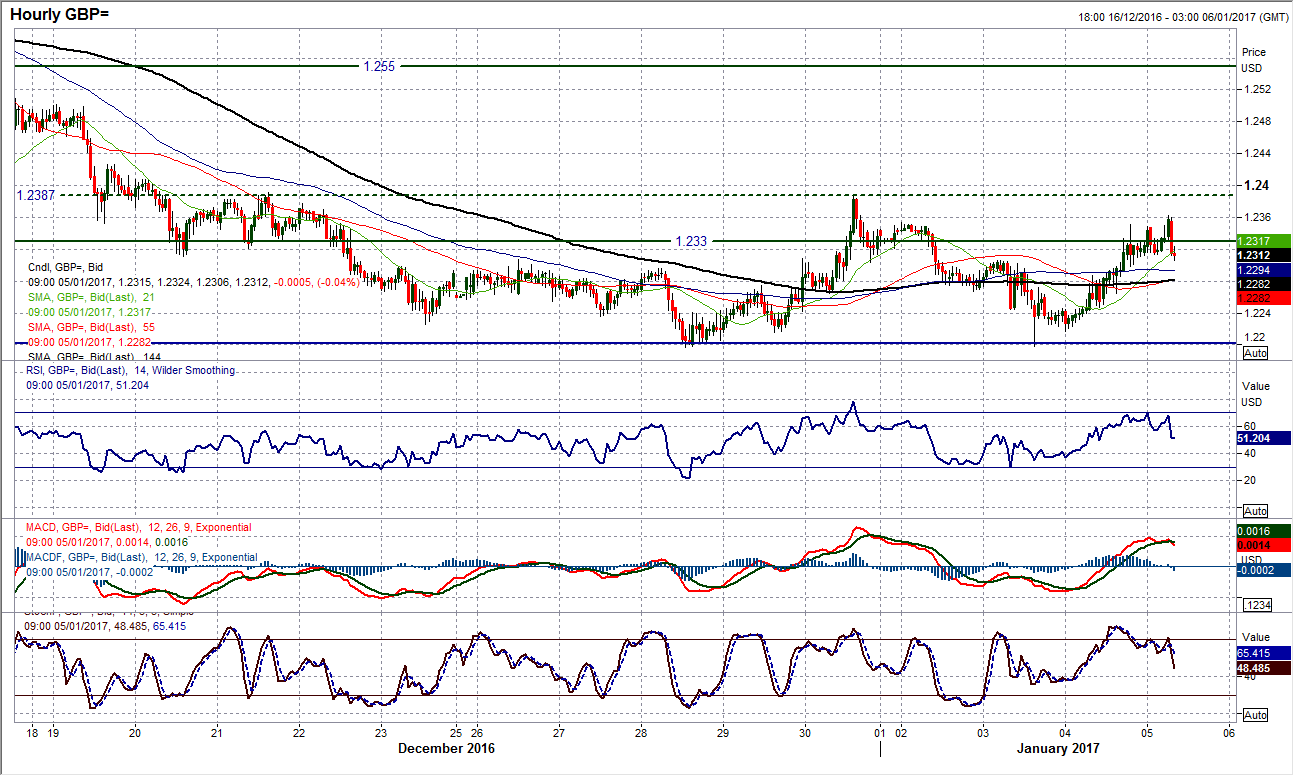
As the dollar has just started to come of its highs, Cable has started to rebound. The positive candle formation yesterday has helped to improve the outlook for the near term and this is looking to continue today. There has been a minor pick up in the momentum indicators, most notably being the Stochastics which have given a near term buy signal. The old pivot around $1.2300/$1.2330 is being breached this morning and this points towards a test of the near term resistance of the late December high at $1.2387. The market is taking on an increasingly rangebound configuration between $1.2080/$1.2775 and needs a closing break above $1.2387 to re-open upside within the range. The outlook on the hourly chart is a little more constrained with the momentum just rolling over a touch this morning and suggests that $1.2387 will be a challenge. $1.2300 is initially supportive with $1.2197 still key near term.
USD/JPY
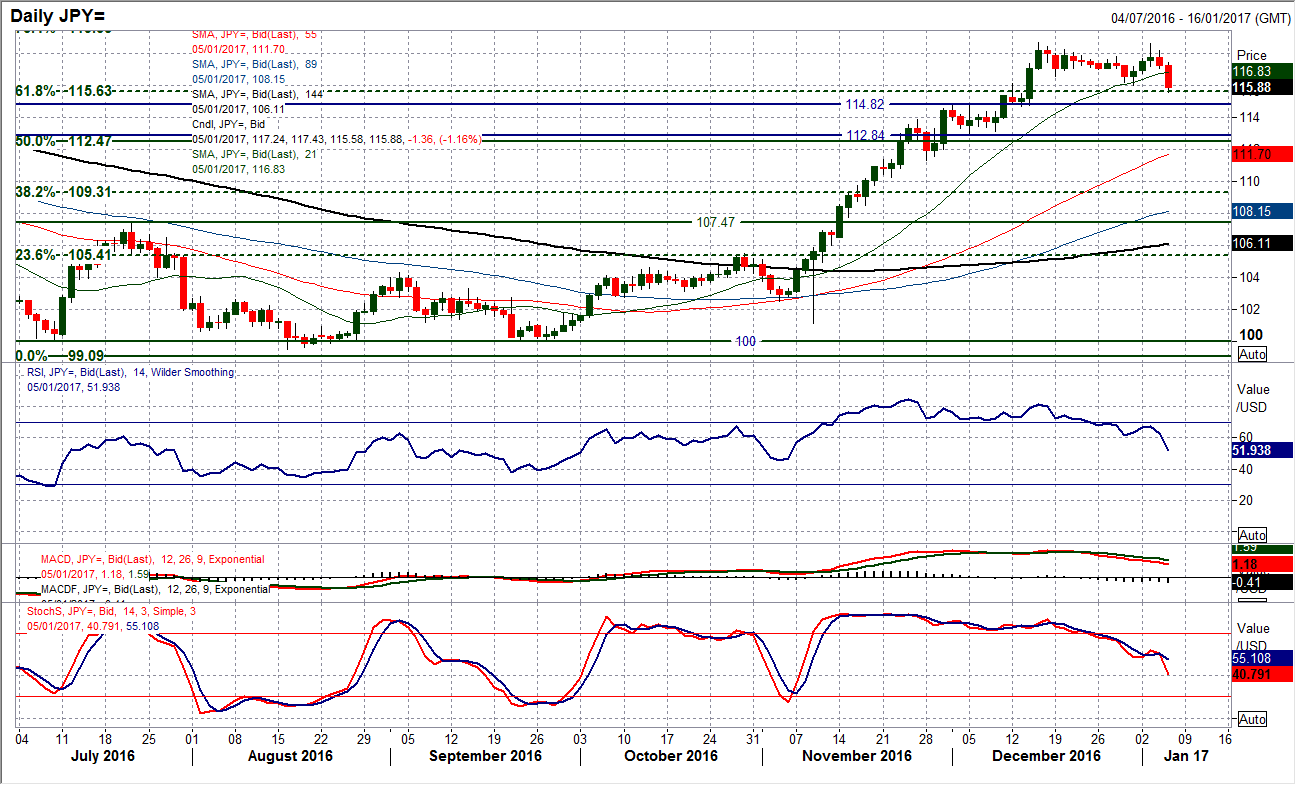
The concerns that I had yesterday with a break below 117.20 forming a near term top pattern have come to fruition as the market has corrected back towards the near term key support at 116.02. This has been the support of the range in place for the past three weeks and will be seen as a key marker. Already this morning USD/JPY has dropped decisively below the rising 21 day moving average (c. 116.84) for the first time since early November, whilst the momentum indicators continue to drop away. The Stochastics are deteriorating again with the MACD lines falling. The RSI is also falling back towards 50. This pressure is ramping up today and a closing breach of 116.02 would complete a near term top and imply another 250 pips of correction potentially. However there is strong support 112.85/114.82 and the RSI will also be an interesting indicator to watch as the bulls have supported above 45 throughout this bull run. The near term outlook will turn corrective below 116.02 but I am still bullish medium/longer term.
Gold
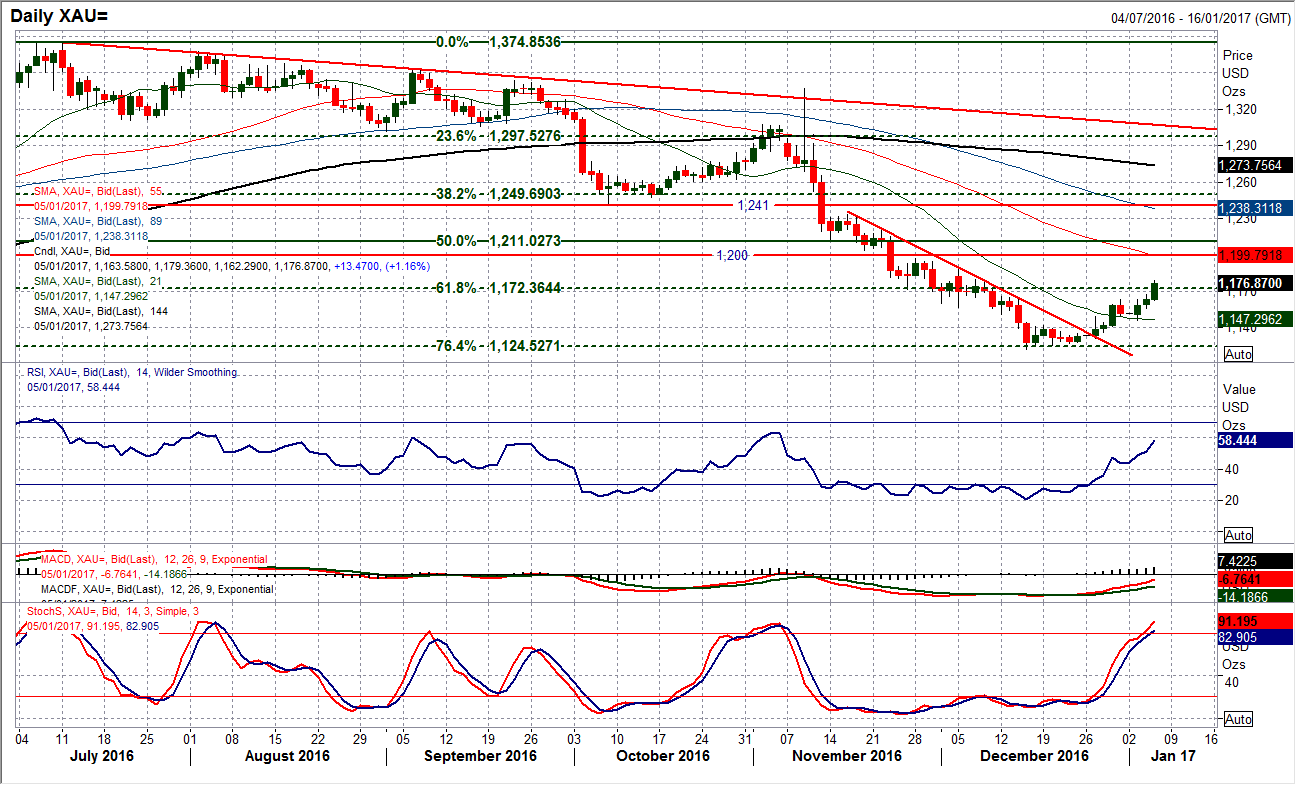
Gold has moved into recovery mode, a move which coincides with the dollar moving into correction. I had been sceptical of the late December rally, however each day this week the gold price has been pulling higher and the recovery is gathering pace. The move this morning is now through the 61.8% Fibonacci retracement at $1172 with the market eying the overhead resistance that comes in at $1180.20 and $1187.70. I do though remain cautious with chasing gold too far higher as bear market rallies have been continually sold into over the past few months. The RSI is also close to 60 again, a level which seems to be around where the rallies are also limited. For now though the bulls are confident and the hourly chart is positively configured for upside. Quite how long this upside lasts for is another matter.
WTI Oil
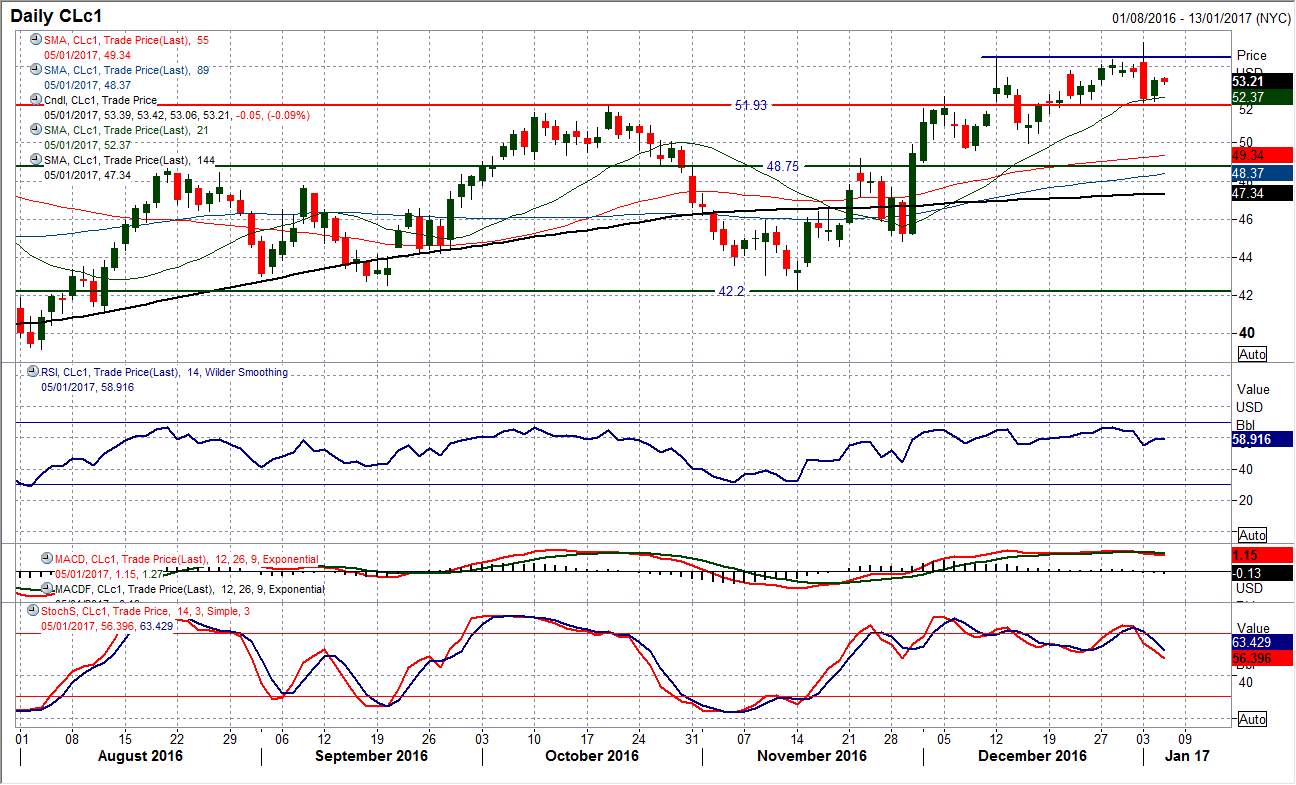
The big bearish candle posted on Tuesday continues to dominate the near term outlook and although the market bounced into the close last night (helped once more by dollar weakness), there is still a risk of continued profit taking. The momentum indicators have taken a turn for the worse with the MACD lines crossing lower and the Stochastics also now in decline. Watch for the RSI dropping back below 50 which would be confirmation of a more corrective outlook. A close below $52.00 would open a corrective move back towards the key near term support band of the December lows between $49.60/$49.95. The hourly chart shows resistance is now in place at $53.40 and continued trading below here will add to the overhead pressure, so will be a key level in today’s trading. A decisive move above $53.40 improves the outlook and opens $54.35 and the high at $55.25.
Author

Richard Perry
Independent Analyst


