Factor allocation doesn’t necessarily make you smart, n’est-ce pas gros bêta!

This article was originally published on Jun 22th, 2017
Factor allocation, also known as “smart” beta, has gained notable popularity over the last couple of years. This accessible form of quantitative investing enables investors to allocate to perceived return drivers such as momentum, value or low volatility. Investors argue that factor allocation brings both direct risk reduction and improved diversification relative to their equity portfolios. Yet the underlying payoffs are probably not what these investors signed up for.
For those who speak French, sorry about the horrendous pun. For those unfamiliar with la langue de Moliere, “bêta” means naïve (or idiot if you’re feeling unkind). And while naiveté can be charming, in the world of investing it’s a recipe for disaster.
Simply stated, factor allocation is just an algorithmic allocation to stocks, following a rule such as overweighting the lowest P/E. The most common factors identified are growth, dividend, value, momentum, minimum volatility, quality and size tilt. But broadly speaking, we can classify these strategies into two categories: long volatility and short volatility.
Long volatility strategies: momentum, growth and quality
A momentum strategy buys stock on price strength and sells on price weakness. Functionally, this is similar to buying a stock covered by a put option as the strategy would discard a stock if it fell below a certain price point.
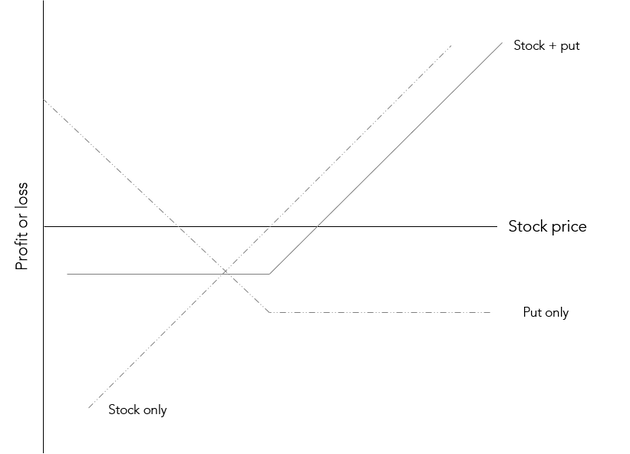
As such, the strategy benefits both from price appreciation and from increasing realized volatility (above the paid implied volatility). We can thus state that momentum is long volatility. We can easily extend this to quality and growth.
Short volatility strategies: value, minimum volatility and dividend
Value is the anti-momentum strategy. Since we showed above that momentum is long volatility (long the underlying and long a put option), value can be understood as being short volatility (long the underlying and short a call option). Dividend exhibits a similar dynamic.
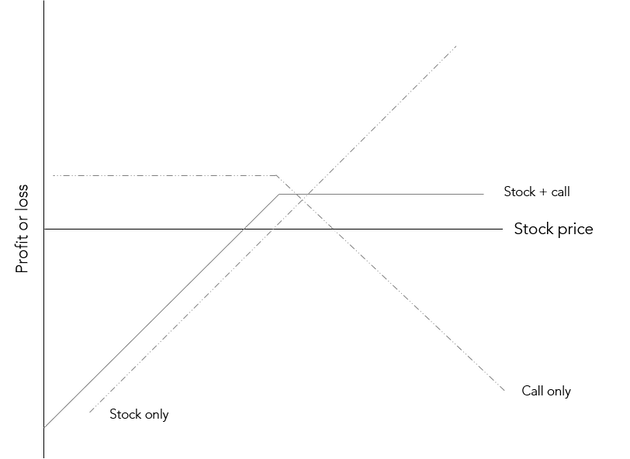
As shown in a previous piece, minimum volatility strategies are equivalent to a short volatility position : “Suppose you have two portfolios which in aggregate represent the market. Portfolio A has a volatility of 10% while Portfolio B has a volatility of 20%. If investors overweight Portfolio A relative to Portfolio B, the aggregate portfolio (the market) will see a reduction in its volatility, assuming of course volatility of each portfolio remains constant.”
Beta then, beta now. But to what?
Historically, we can clearly see how the performance of factors is tied to the volatility regime. Taking momentum and value as examples, it’s quite clear what is driving performance.
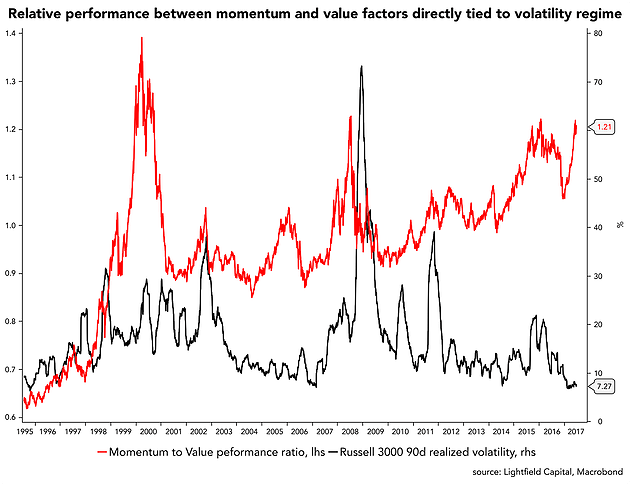
And this is why the relative performance since December is so confounding! With volatility continually dropping, we should have seen value outperform momentum, and yet the exact opposite has happened.
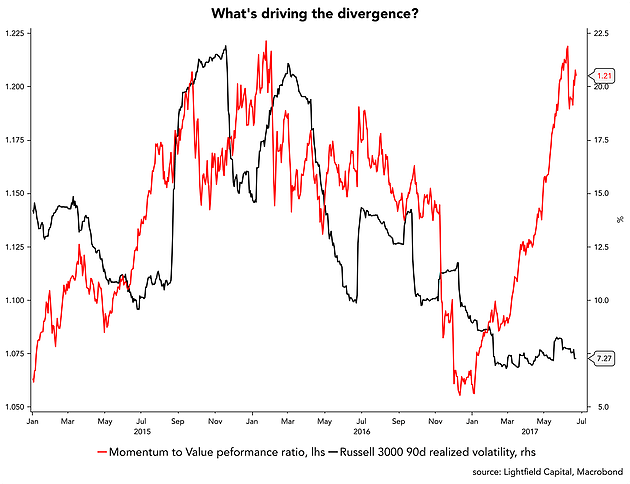
As usual with these kind of divergences, the reason is usually the same: flow.
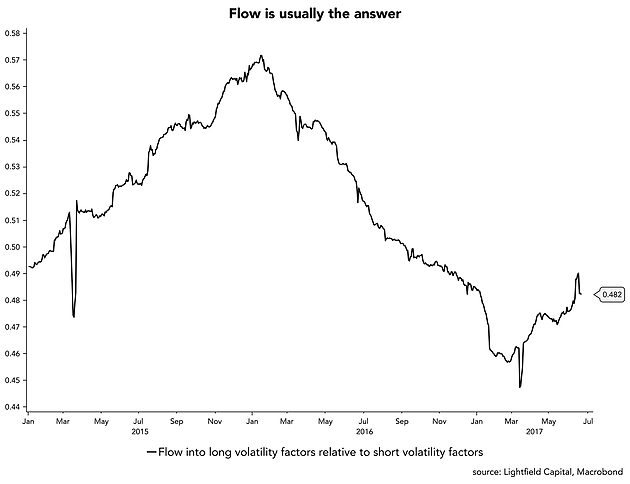
What happens if you have a strongly performing strategy with declining volatility? Well you buy more of it. Which in turns drives performance and lower volatility. So you buy more… Especially if you can justify it through greater “diversification”. Reflexivity at its finest.
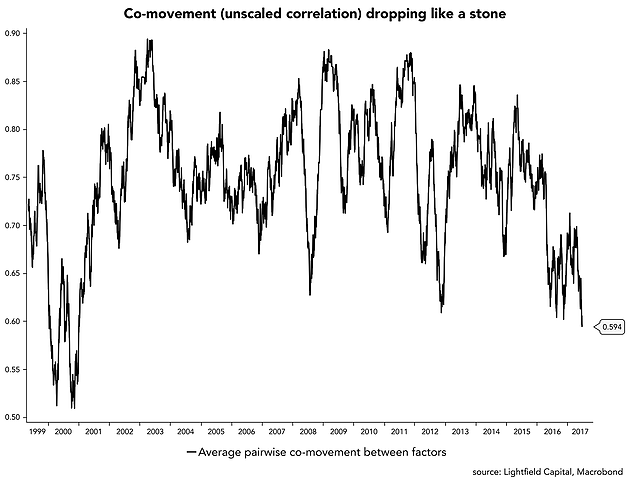
All this tells me that we are seeing yet another misunderstood piling of leverage into an environment where the supply/demand balance for stocks is turning materially (and structurally) negative due to boomer outflow. If you are looking for a signal that this leverage cycle is about to turn, look no further than the Federal Reserve indicating their willingness to keep raising rates and shrink their balance sheet despite falling inflation.
So while in the short term your returns may have looked charming, please don’t end up being the “bêta” of this story.
Author

Samuel Gruen
Lightfield Capital
Samuel Gruen is the founder and portfolio manager at Lightfield Capital. Prior to Lightfield he was a trader at Cube Capital, a $1.1bln multi-strategy fund with a 12 year track record.