Facebook Waves a Red Flag

Chaos Clinic for 2/14/2020
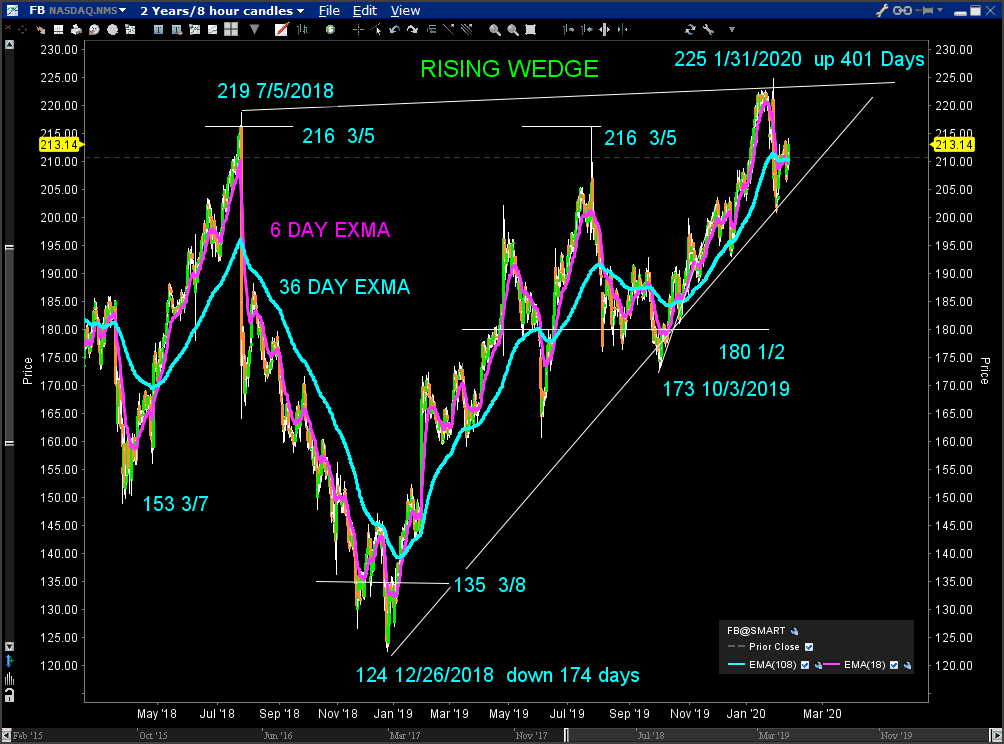
Facebook may be vulnerable to a major downturn. This two year 8 hour bar chart shows that it has formed a rising wedge. While the 36 day trend is up, it has flattened after a sharp drop on 1/31/2020. The drop broke back below the 216 level of prior tops.
That drop came from a price of 225, which is a harmonic 5/8 of a 360 degree circle. Previous highs in 2018 and mid 2019 were from 216, the 3/5th part of the circle. Support came in in late 2019 loosely around 180, 1/2 a circle.
The second half of 2018 saw Facebook drop from 219 to 124 in 174 calendar days. a 43% drop in less than 6 months, of -5.3 points per day.. The ensuing rally of 101 points took 401 days, about 4 points per day. The slower rally speed
suggests less energy.
Trendlines along the highs and the lows outline the rising wedge. Trading is now trapped in the small end of the wedge. Prices may congest within it into June. But if prices break down below the bottom trendline, a serious decline could occur. This looks like a trade setup to watch.
This content was published on Dr. Al Larson's Chaos Clinic which you can attend each Friday for free.
Dr. Al Larson has developed a complete Chaos Model of Markets, four unique courses that let you become a Certified Chaos Trader, some very unique eMylar fractal pattern overlays, and tools that permit forecasting individual stocks and markets years in advance. You can also sign up for a free weekly email, and attend a free Chaos Clinic on Fridays. To learn more, click on the author's profile.
Be sure to sign up for the free weekly email!
Author

Dr. Al Larson, PhD
MoneyTide.com
Dr. Al Larson holds a Ph.D. in Electrical and Computer Engineering from the University of Wisconsin. He is a 1964 Distinguished Graduate of the U. S. Air Force Academy.


