Facebook Torpedoes Markets

Good Morning Traders,
As of this writing 5:30 AM EST, here’s what we see:
US Dollar: Jun. USD is Up at 89.495.
Energies: May '18 Crude is Up at 62.68.
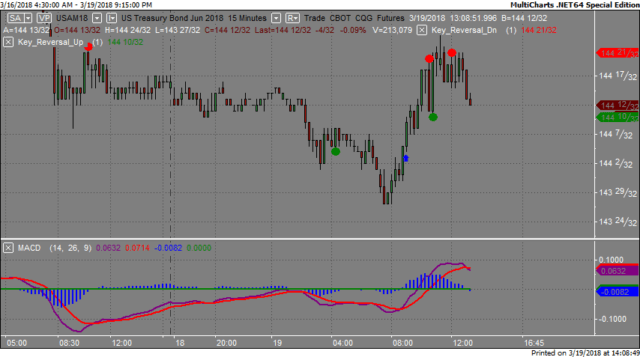
Financials: The June 30 year bond is Down 11 ticks and trading at 144.06.
Indices: The June S&P 500 emini ES contract is 6 ticks Lower and trading at 2721.25.
Gold: The April gold contract is trading Down at 1314.60. Gold is 32 ticks Lower than its close.
Initial Conclusion
This is not a correlated market. The dollar is Up+ and Crude is Up+ which is not normal but the 30 year Bond is trading Lower. The Financials should always correlate with the US dollar such that if the dollar is lower then bonds should follow and vice-versa. The S&P is Lower and Crude is trading Up+ which is correlated. Gold is trading Down- which is correlated with the US dollar trading Up+. I tend to believe that Gold has an inverse relationship with the US Dollar as when the US Dollar is down, Gold tends to rise in value and vice-versa. Think of it as a seesaw, when one is up the other should be down. I point this out to you to make you aware that when we don't have a correlated market, it means something is wrong. As traders you need to be aware of this and proceed with your eyes wide open.
At this hour Asia is trading mainly Higher with the exception of the Aussie and Nikkei exchanges which are Lower at this time. Currently all of Europe is trading Higher.
Possible Challenges To Traders Today
-
No major economic news to speak of.
-
Lack of major economic news.
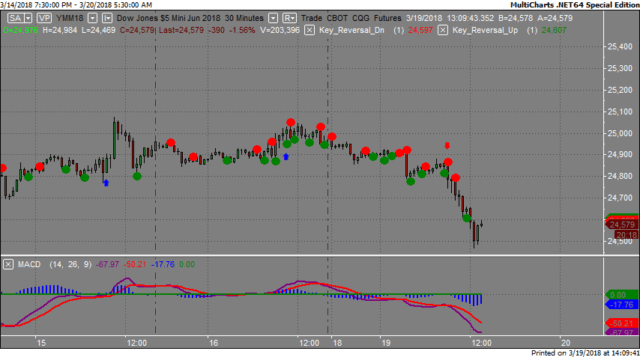
Treasuries
We've elected to switch gears a bit and show correlation between the 30 year bond (ZB) and The YM futures contract. The YM contract is the DJIA and the purpose is to show reverse correlation between the two instruments. Remember it's liken to a seesaw, when up goes up the other should go down and vice versa.
Yesterday the ZB made it's move at around 9 AM. The ZB hit a Low at around that time and the YM hit a High. If you look at the charts below ZB gave a signal at around 9 AM EST and the YM was moving Lower at the same time. Look at the charts below and you'll see a pattern for both assets. ZB hit a Low at around 9 AM and the YM hit a High. These charts represent the newest version of MultiCharts and I've changed the timeframe to a 30 minute chart to display better. This represented a Long opportunity on the 30 year bond, as a trader you could have netted about a 20 ticks per contract on this trade. Each tick is worth $31.25.
Charts Courtesy of MultiCharts built on an AMP platform
Bias
Yesterday we gave the markets a Neutral bias as all instruments we track we pointed higher and that included the indices. The Dow dropped 336 points and the other indices lost ground as well. Today we aren't dealing with a correlated market and our bias is Neutral.
Could this change? Of Course. Remember anything can happen in a volatile market.
Commentary
Yesterday morning we quickly came to the conclusion that there just wasn't something right in the markets. All instruments we track were pointed higher Monday morning and that included the indices themselves. This shows no correlation and no trend hence the Neutral bias. The analysts and pundits now claim that this was because of a mishap committed by Facebook whereby client information was given out without their approval. This caused a slide that affected the indices themselves. Whereas today there is no economic news to speak of; come tomorrow that will change as we have the FOMC meeting....
Author

Nick Mastrandrea
Market Tea Leaves


