External balance supports AUD

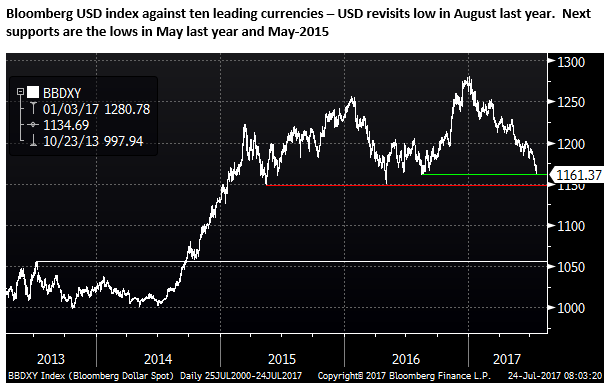
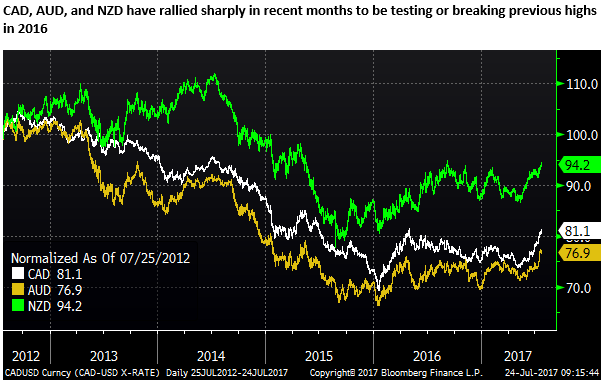
The USD has taken a decent beating this year. On broad indices, it was at a high in around 15-years in January, and in the space of six months, accelerating in the last three, it is down around 8% to be testing the low side of its range for the last two-and a half years. The market may be getting into a short/bearish position for the USD, but it is not excessive, and if the US macro-outlook can’t pull its socks up, it is quite possible to see a deeper correction for the USD in the order of 5 to 10%. The fall in the USD reflects the unwinding of initial optimism related to the Trump and Republican election victory. And the higher risk of political uncertainty or gridlock in the USA. It also reflects a mediocre US economic performance, while global growth appears more synchronized and stronger than it has been for some years. The US has improved its 2yr yield advantage against most countries over the last year, but US 2yr swap rates peaked in March, and the Fed may now keep rates on hold for a prolonged period while it assesses market reaction to a balance sheet run-down. Stronger growth momentum abroad may keep the USD in a downtrend as unhedged equity flows boost other currencies. This helps account for the resurgent EUR this year. There is scope for Trump and the Republican Party to restore optimism by moving forward the stalled legislative agenda, but uncertainty is elevated heading into the debt ceiling, spending bill and budget negotiations over the next few months. The CAD, AUD, and NZD have been at the forefront of the rebound in global currencies against the weaker USD. We look at the external balance for these three currencies, the Australian current account position is at its strongest position in 35-years, suggesting upside risk for the AUD in a stable global environment.
USD unravels
The USD has taken a decent beating this year. On broad indices, it was at a high in around 15-years in January, and in the space of six months, accelerating in the last three, it is down around 8% to be testing the low side of its range for the last two-and a half years. It is currently holding on to about a third of its gains since mid-2014, when the USD began its surge on monetary policy divergence.
The market may be getting into a short/bearish position for the USD, but it is not excessive, and if the US macro-outlook can’t pull its socks up, it is quite possible to see a deeper correction for the USD in the order of 5 to 10%.
In the broad scheme of developments: monetary policy is no longer diverging, although it is also not converging yet; The USA President is generating significant political risk on a variety of levels; USA Economic growth has failed to impress, whereas global growth is more synchronized and robust.
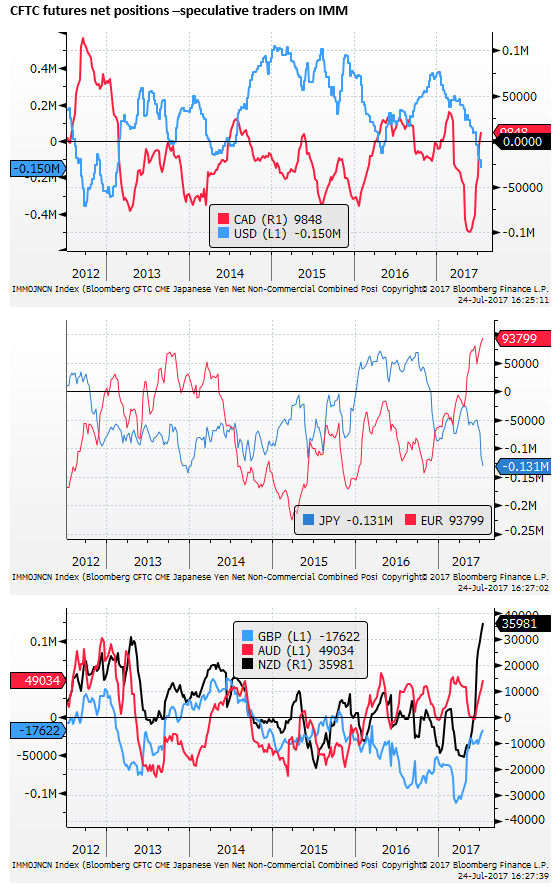
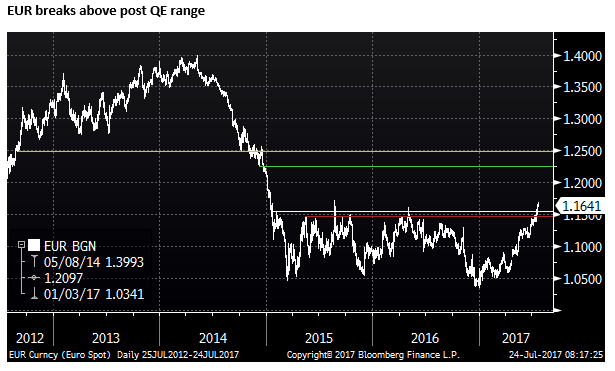
The EUR has essentially broken through the top of its range since the ECB enacted its QE policy in January 2015. Most of that trading was done below 1.15, apart from for a couple of bursts in short covering rallies. The most recent rise above 1.15 appears more solid, and sentiment is obviously quite different as now the market is significantly long EUR (according to CFTC futures data).
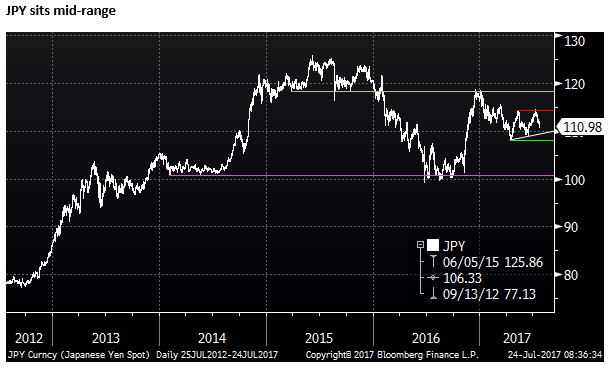
The JPY fall against the USD began earlier than most, falling rapidly in 2013 in response to its QE program enacted by BoJ Governor Kuroda, and it reached its high in 2015. It led the fall in the USD in 2016, but it has been more stable this year, sitting close to mid-range since 2014. Notably, the market is significantly short JPY, in contrast to other currencies.
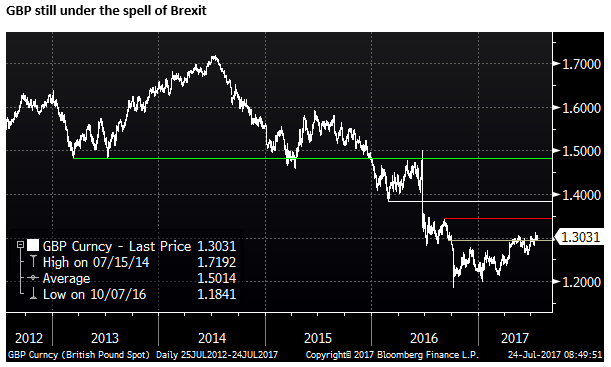
The GBP is still largely under the spell of Brexit uncertainty. Before Brexit was an issue, GBP was closer to 1.50. It has recovered in a choppy unsure fashion since its Brexit related lows in October 2016. But it is now struggling near the low end of the range from 1.30/1.35 set in the first four months after Brexit.
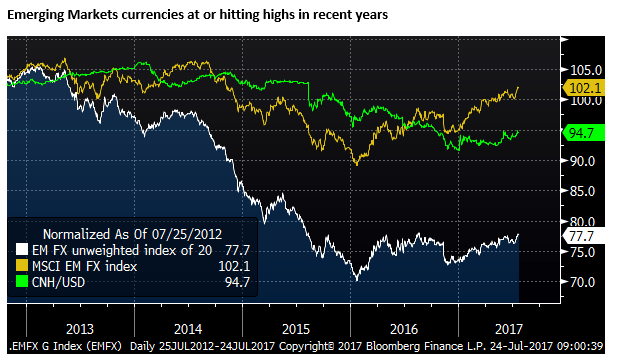
EM FX indices have rallied this year to be testing or at highs in recent years. The MSCI Emerging market equity weighted FX index is at a high since 2014. It fact it has retraced around two-thirds of its fall from the high in 2014 to the low in early 2016.
An alternative view of EMFX is one created by a Bloomberg analyst that is an unweighted index of 20 EM currencies that excludes CNY. It shows EM currencies testing around their highs in 2016.
The chart below also shows the CNH. It led much of the weakness in emerging market currencies with its sudden devaluation in August 2015 and rapid fall in early 2016. It remained weak throughout 2016, while other EM currencies recovered. CNH has strengthened this year, but it has still generally lagged other EM currencies, although rising in a more consistent fashion in recent months.
Commodities less correlated with the USD in the last year
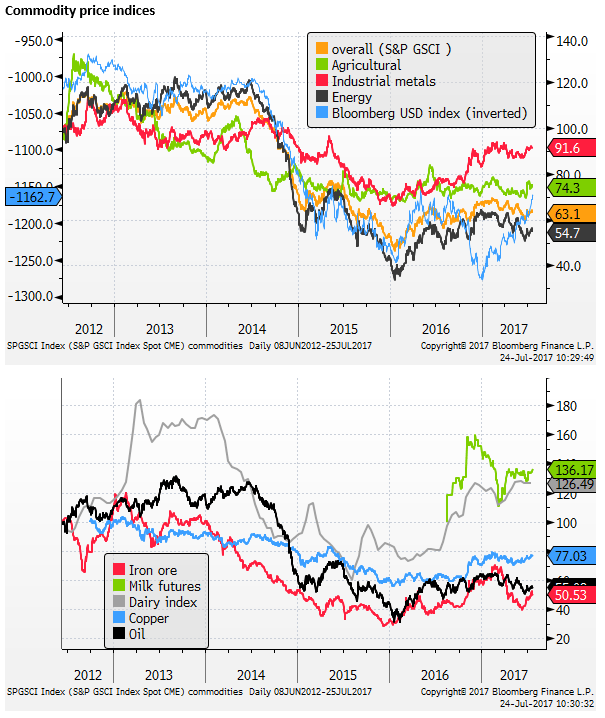
Commodity prices have broadly risen in the last month, possibly in response to a weaker USD. However, overall there has been less correlation between the USD and commodities over the last year. Commodities tended to firm despite a strong USD in late 2016; at this time global growth confidence and US growth confidence were rising together, helping commodity prices rise despite a rising USD.
The performance of commodity prices this year has been underwhelming; they have not been able to rally much despite a weaker USD. In the case of energy prices, this reflects excess supply as US production has increased while OPEC and Russia attempt to work off excess inventory with production caps.
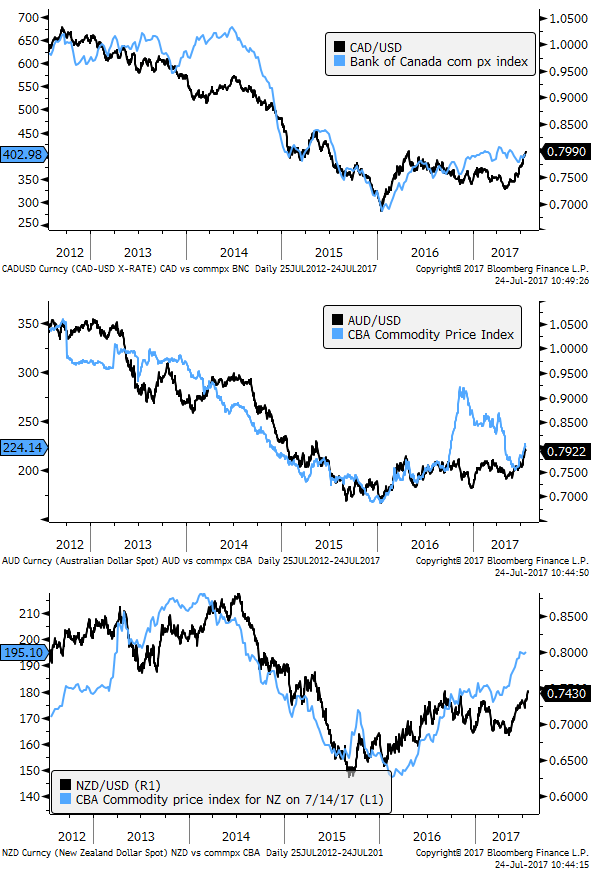
Commodity currencies and their commodity prices
The overall lacklustre commodity price performance this year begs the question are commodity currencies getting ahead of themselves.
Certainly, in the case of the CAD, it has rallied sharply in recent months despite a mixed oil price performance; responding instead to a Bank of Canada rate hike. AUD is not out of line with its commodities. The relative strength in the NZD is supported by a strong recovery in dairy prices and firmer forestry and livestock prices.
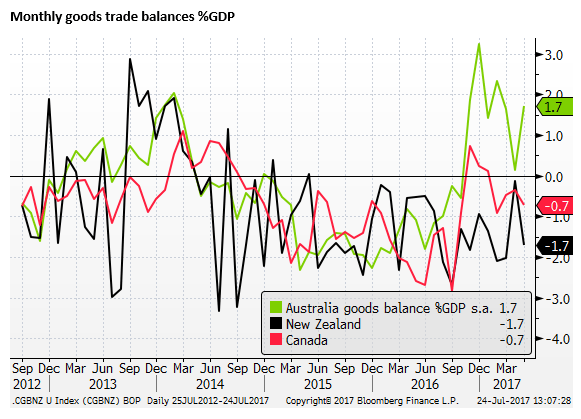
Australian external position strongest in over 35 years
Regarding external balance, Australia has achieved a significant improvement over the last year, moving from a merchandise (goods) balance deficit of around 1.5 to 2.0% of GDP to a surplus of 1.7% in May. Both New Zealand and Canada remain in deficit.
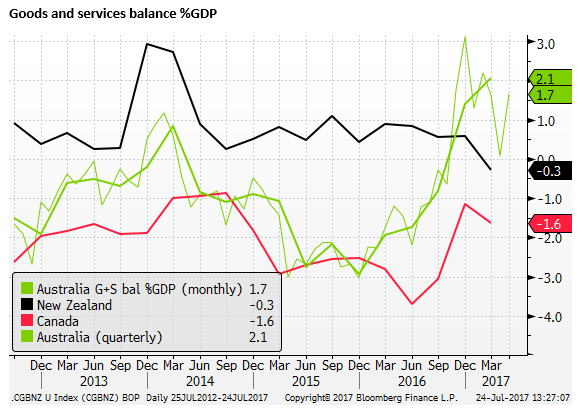
Including services, improves the position of New Zealand with a services surplus of 1.5% in Q1, helping offset its goods deficit, but still leaving it with a G+S deficit in Q1 of 0.3% of GDP. Canada, on the other hand, has a significant services deficit of 1.2% of GDP, generating a G+S deficit in Q1 of 1.6% of GDP. Australia has relatively balanced services trade, and its G+S balance was 2.1% in Q1 of GDP, and 1.7% in May.
The Australian external position remains highly variable and dependent on commodity prices. However, following the mining investment boom that peaked in 2013, it is now showing up in stronger net exports and a narrower deficit.
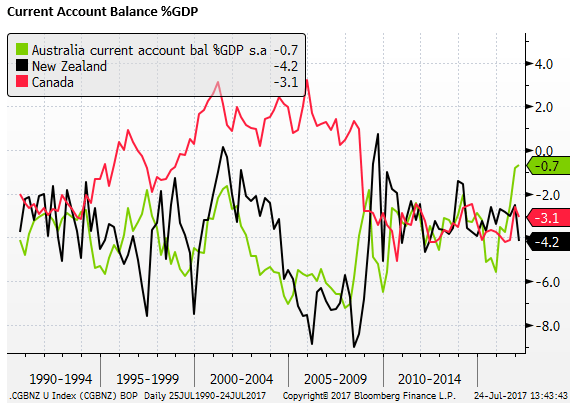
The overall current account balances, incorporating significant deficits in income payments, remain in deficit for all three countries. Although in Q1, the Australian deficit has narrowed to a relatively small 0.7% of GDP; its narrowest since 1979. The New Zealand deficit was 4.2% of GDP in Q1 and Canada’s was 3.1% of GDP.
New Zealand may be benefiting from higher commodity prices, but its net export performance has shown little clear improvement. In part this may reflect above average economic growth supported by rapid immigration, boosting import growth. But it also suggests that the exchange rate may be high enough to be dampening exports and boosting imports, diverting demand offshore and lowering domestic inflation.
The New Zealand balance of payment deficit suggests that it still needs to offer a relatively high level of real interest rates to stabilize the exchange rate.
Interestingly, Canada has only recently closed its 2yr swap rate gap with the USA after its recent rate rise. The interest rate gap has perhaps become more important for the CAD since it has moved to a current account deficit more frequently since the Global Financial Crisis.
On the other hand, interest rate differentials appear to be playing a lesser role in currency direction for many other currencies in the last year, including Australia and New Zealand.
Author

Greg Gibbs
Amplifying Global FX Capital
Greg has had a long career in foreign exchange. He began his career at the Reserve Bank of Australia in 1989 and in the early 1990s he was the first economics graduate at the Bank to be assigned to the foreign exchange dealing desk.


