|

Exploring the widening gap between GDP and GDI

Summary

While it is generally something of an anomaly, it is not unprecedented for growth in income to fall behind growth in expenditures. This can happen for any number of reasons from labor market challenges to corporate profitability concerns to external trade dynamics. This report looks at why it is happening now and what it says about the likelihood of recession.

Q2 GDP growth held steady, but movement under the hood

The third estimate of real GDP growth released last week included benchmark revisions going back 10 years. The data showed the U.S. economy expanding at a 2.1% annualized rate during the second quarter. While unchanged from the second estimate, there was some substantial movement in the underlying components. Growth in real personal consumption expenditures (PCE) was revised down 0.9 percentage points (pp) to just a 0.8% annualized rate, while the growth rate in gross private investment was revised up 1.9pp to a sturdy 5.2% annualized rate.

The marked deceleration in PCE appears to be mostly driven by benchmark revisions, but the reduction in PCE’s contribution to Q2 GDP growth (0.55pp from 1.14pp previously) signals less momentum in consumer spending than previously thought. Elsewhere, the revisions showed a 4.9pp boost to growth in non-residential construction, which helped lift growth in total business fixed investment to a 7.4% annualized rate, and an upwardly revised $14.9B inventory build translated into a neutral force on topline GDP growth. All these adjustments left real GDP up 2.4% on a year-over-year basis, in line with the second estimate and its 2019 average.

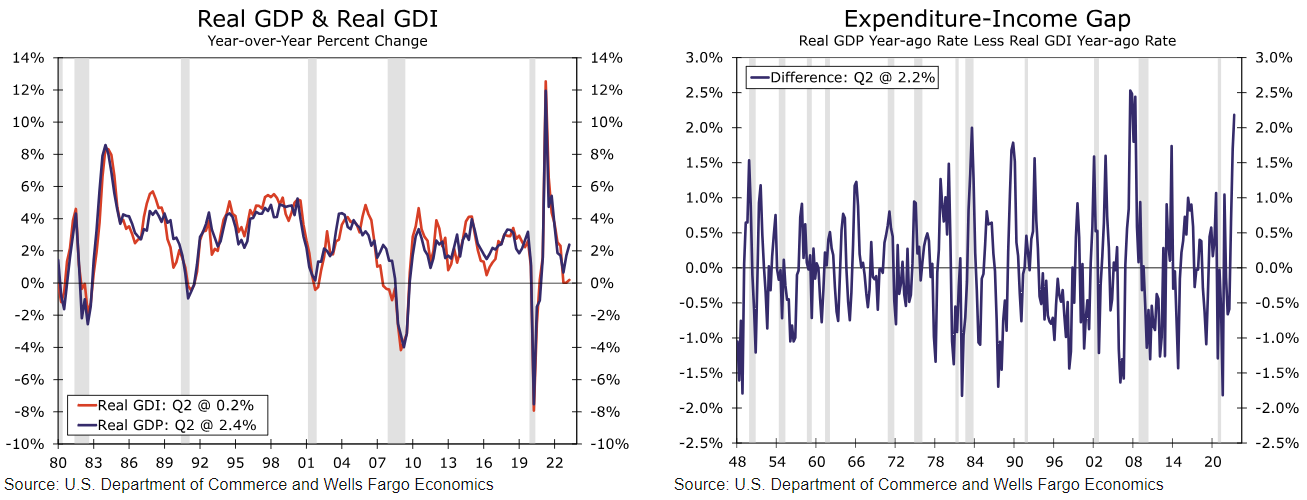
What is most interesting to us is that the gap between real GDP and real gross domestic income (GDI) remains unusually wide in this updated Q2 data. As seen in Figures 1 and 2, real GDI was up just 0.2% on a year-ago basis in Q2, leading to the widest gap (2.18pp) between real GDP and real GDI since 2008. In theory, the two measures should be the same, though in practice they can differ because they are constructed using independent source data. In the parlance of the BEA, this difference is called the statistical discrepancy. GDP looks at the expenditure side of the economy, while GDI tallies the income side.

Chart

Download The Full Special Commentary

Author

More from Wells Fargo Research Team
Share:

Markets move fast. We move first.

Orange Juice Newsletter brings you expert driven insights - not headlines. Every day on your inbox.

By subscribing you agree to our Terms and conditions.

Editor's Picks

EUR/USD stays defensive below 1.1750 as USD finds its feet

EUR/USD kicks off the new week on a softer note, holding below 1.1750 in European trading on Monday. The pair faces challenges due to a pause in the US Dollar downtrend, with traders shifting their focus to the delayed US Nonfarm Payrolls and CPI data for fresh directives. The ECB policy decision is also eagerly awaited. 

GBP/USD holds steady above 1.3350 as traders await key data and BoE

GBP/USD remains on the back foot above 1.3350 in the European session on Monday, though it lacks bearish conviction and holds above the key 200-day SMA support. The US Dollar holds its recovery mode ahead of key data releases, while the Pound Sterling faces headwinds from the expected BoE rate cut this week. 

Gold climbs to seven-week highs on Fed rate cut bets, safe-haven demand

Gold price rises to seven-week highs to near $4,350 during the early European trading hours on Monday. The precious metal extends its upside amid the prospect of interest rate cuts by the US Fed next year. Lower interest rates could reduce the opportunity cost of holding Gold, supporting the non-yielding precious metal.

Solana consolidates as spot ETF inflows near $1 billion signal institutional dip-buying

Solana price hovers above $131 at the time of writing on Monday, nearing the upper boundary of a falling wedge pattern, awaiting a decisive breakout. On the institutional side, demand for spot Solana Exchange-Traded Funds remained firm, pushing total assets under management to nearly $1 billion since launch. 

Big week ends with big doubts

The S&P 500 continued to push higher yesterday as the US 2-year yield wavered around the 3.50% mark following a Federal Reserve (Fed) rate cut earlier this week that was ultimately perceived as not that hawkish after all. The cut is especially boosting the non-tech pockets of the market.

Solana Price Forecast: SOL consolidates as spot ETF inflows near $1 billion signal institutional dip-buying

Solana (SOL) price hovers above $131 at the time of writing on Monday, nearing the upper boundary of a falling wedge pattern, awaiting a decisive breakout.