Explaining Volatility and its Importance

Volatility, simply put, measures how much a series (whatever series that may be) fluctuates. More particularly, by fluctuating we mean how much it deviates from its average and is measured through what is known as the standard deviation. Without going into the mathematics of the issue, let’s have a look at how averages and volatility affect investment decisions.
The average is simply used as a benchmark for what we can expect from the asset. For example, if Asset A increases by 1% on Day 1, 1.5% on Day 2, and 1.7% on Day 3, then we can say the average growth of the asset is simply (1%+1.5%+1.7%)/3, resulting to 1.4%. This 1.4% suggests the average daily return one could obtain from holding the asset for three days.
Volatility serves as a proxy for risk. In our previous example, volatility would be just 0.36 (interested readers can refer to this formula for the calculation), indicating relatively low movement around the average.
Now, imagine that we have Asset B, which has registered returns of 2% on Day 1, -11.3% on Day 2, and 13.5% on Day 3. The average daily return is still 1.4%, but few traders would have been happy with the huge drop on Day 2. This is where volatility is useful: in this case, volatility is 12.4 which suggests a relatively high movement around the average.
As such, volatility could be interpreted as a measure of the riskiness of an asset, even though this should not be looked at independently from the average return. The table below provides an example of just how deceptive focusing on just one of the two can be.
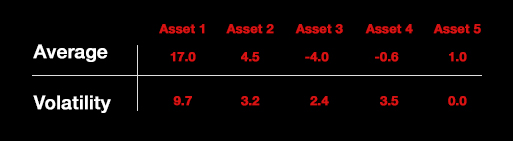
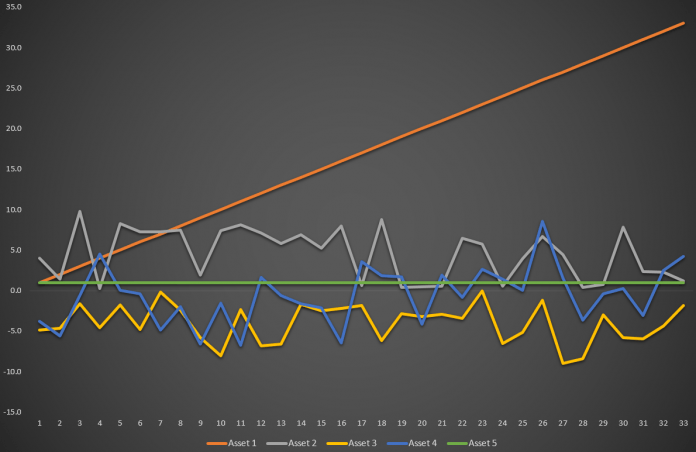
Asset 1 appears to be the most volatile and hence should be interpreted as the riskier one. Is this justifiable? Not particularly, if one observes the figure at the top of this post. Asset 1 (orange line) has been constantly increasing over time, and thus there would much less risk for our capital compared to Asset 3 (yellow line), which registers negative daily returns.
Looking purely at volatility, one could incorrectly assess that Asset 3 would be a safer investment than Asset 1, while this would be far from truth. As the figure suggests, holding Asset 3 would result in losses, despite its lower volatility. Asset 5 suggests what would happen if one held an asset with zero volatility: this would mean that the average return on that asset would have been fixed, never fluctuating. An example of such an asset are bank deposits where the interest rate is fixed in advance and the investor runs zero risk of losing the invested funds. Still, zero volatility excludes the possibility of higher returns, as in the case of Assets 1 and 2. Naturally, there are times when higher volatility is associated with losses, such as in Asset 4.
Thus, what the trader should remember from the above is that volatility, on its own, is neither good nor bad. Depending on how traders act on it, volatility can either provide opportunities or pitfalls, while it should be remembered that it should be viewed in line with the average return on an asset and not individually. Finally, past volatility of an asset should be viewed as a signpost and not a projector of the future, given that the world of trading is dynamic and asset fundamentals can change dramatically in a short period of time.
Author

With more than 4 years of experience at the Central Bank of Cyprus where he obtained hands-on experience with real-life economics, Dr Nektarios Michail is a supporter of a balanced approach between science and art when it comes to


