Expensive oil and progress in NAFTA negotiations can support the Canadian dollar

In this review, we suggest considering the personal composite instrument (PCI) CAD_Index - currency index CAD. It reflects the price dynamics of the portfolio of major currencies: EUR, USD, GBP, AUD, CHF, JPY against the Canadian dollar. Will the CAD_Index prices rise?
Expensive oil can improve the performance of the Canadian economy, as the share of hydrocarbons in exports exceeds 15%. Note that in addition to oil, Canada also supplies natural gas to the world market, the prices of which are increasing together with oil. It ranks 4th in its exports after Russia, Qatar and Norway. An additional factor for the possible growth of the Canadian dollar may be an increase in inflation in February 2018, year over year to 2.2%. This is the maximum since October 2014. The increase in inflation may prompt the Bank of Canada to raise the rate. Currently, it amounts to 1.25%, which is lower than the US Fed rate (1.5-1.75%). Last week, Canadian authorities said that Canada and the United States had made progress in bilateral talks to renegotiate the North American Free Trade Agreement. This is another positive factor for the Canadian dollar. The next meeting of the Bank of Canada will be held on April 18, 2018. This Thursday, there will be data on Canadian GDP for January, which may affect the exchange rate.
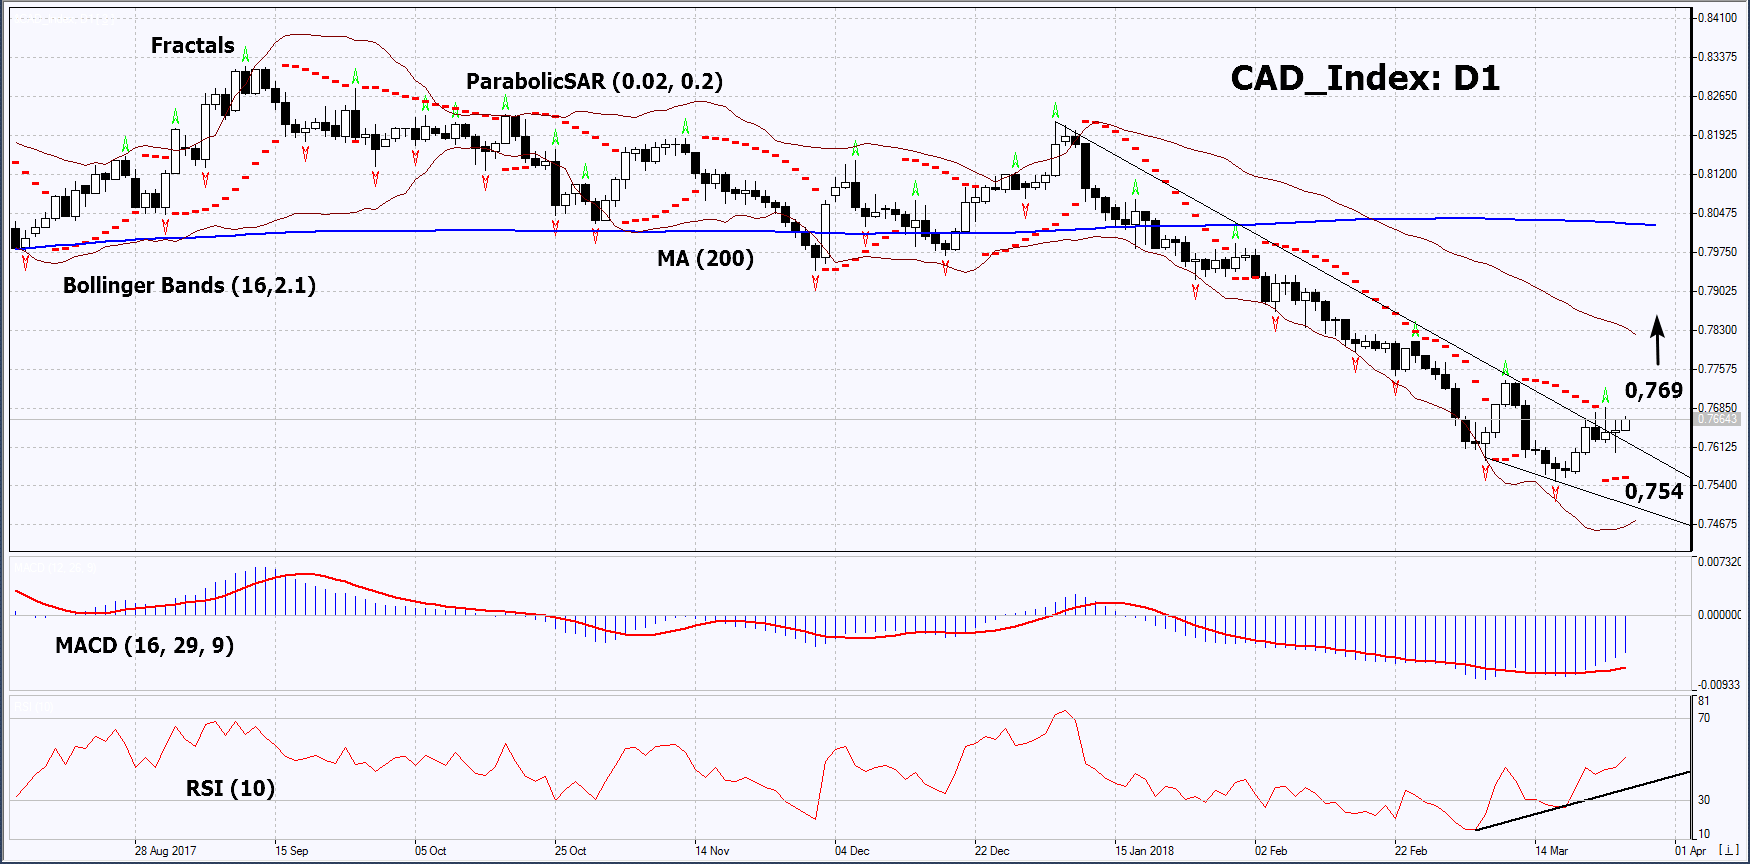
On the daily timeframe, CAD_Index: D1 moved upward from the downtrend. The further price increase is possible in case of the publication of positive economic data in Canada and the preservation of high oil prices.
-
The Parabolic indicator gives a bullish signal.
-
The Bollinger bands have widened, which indicates high volatility. The lower band is tilted upward.
-
The RSI indicator is near 50. It has formed a positive divergence.
-
The MACD indicator gives a bullish signal.
The bullish momentum may develop in case CAD_Index exceeds the last fractal high at 0.769. This level may serve as an entry point. The initial stop loss may be placed below the last fractal low, the 2-year low and the Parabolic signal at 0.754. After opening the pending order, we shall move the stop to the next fractal low following the Bollinger and Parabolic signals. Thus, we are changing the potential profit/loss to the breakeven point. More risk-averse traders may switch to the 4-hour chart after the trade and place there a stop loss moving it in the direction of the trade. If the price meets the stop level at 0.754 without reaching the order at 0.769, we recommend cancelling the position: the market sustains internal changes that were not taken into account.
Summary of technical analysis
|
Position |
Buy |
|
Buy stop |
Above 0,769 |
|
Stop loss |
Below 0,754 |
Want to get more FREE Analytics? Open Demo Account now to get daily analytical materials and video overviews, experts' opinions etc. Don't forget to subscribe to our YouTube channel.
Want to get more free analytics? Open Demo Account now to get daily news and analytical materials.
Author

Dmitry Lukashov
IFC Markets
Dimtry Lukashov is the senior analyst of IFC Markets. He started his professional career in the financial market as a trader interested in stocks and obligations.


