|

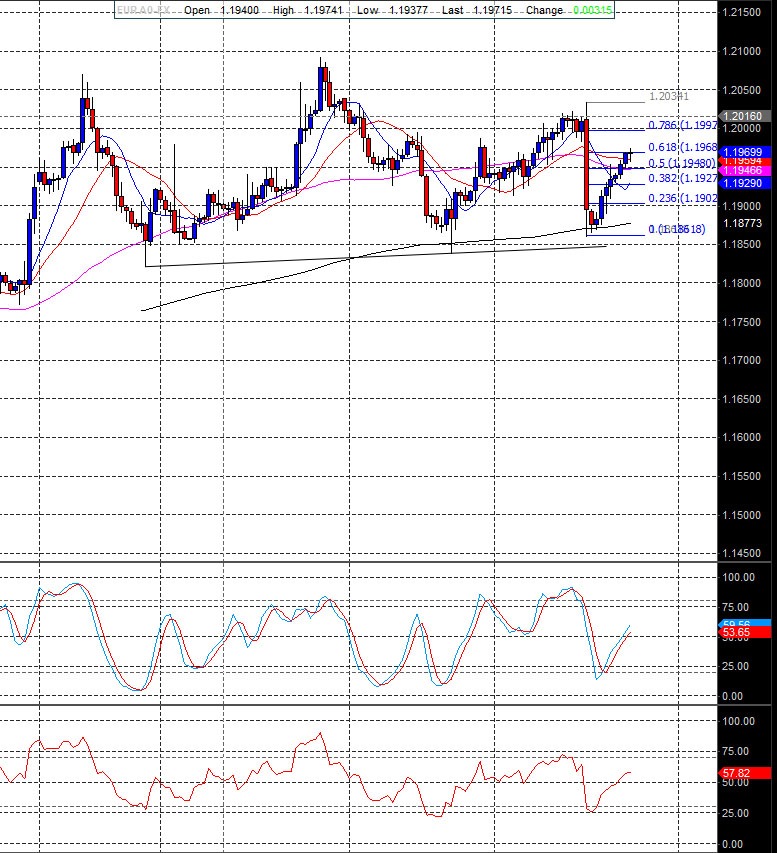
EURUSD: The 78.6 fib is at 1.1998

EUR/USD

The 78.6 fib is at 1.1998..and we have touched this already....So now where...Do we have enough legs to actually move this market higher through 1.20...The chart patterns suggest not...We cannot ignore the H&S pattern formed...but as I said this is possibly the most unreliable pattern unless built up ovr a long time on the weekly charts...and I am not seeing it on this timeframe....Now from extreme overbought conditions on the weeklies....we have eased back to just under 80%....although high...in strong trending markets these indicators really stay up at the higher end of the scale on the longer term time frames...so do not be daunted that these indicators are high....The downward / sideways action of the past few weeks is what was required to take the market from severe overbought levels..

Now we have a bit of work to do on the topside before we are clear of the congestion pattern....but the market pulled back exacyl 23.6 of the move up from 1.1320...so this is quite a bullish factor..as it the med term tech indicators which are currently neutral to pointing higher...We are in an uptrend....so until something changes you are much safer buying into any short term weakness...The key level on the downside is 1.1850 and this I believe will be a difficult level to break below...

The long term monthly level to clear is 1.2180...If done there is no reason at all why we cannot trade upto 1.2370 and then the 1.26 area...which as Iv said previously will be quite a tough level to break above...

eurusd

Author

Carol Harmer

Carol Harmer

Charmer Trading

Carol Harmer has over 39 years experience of analysing and trading the world's markets and is undoubtedly one of the most respected technical trader in the world today.

More from Carol Harmer
Share:

Editor's Picks

EUR/USD tests nine-day EMA support near 1.1850

EUR/USD inches lower during the Asian hours on Monday, trading around 1.1870 at the time of writing. The 14-day Relative Strength Index momentum indicator at 56 stays above the midline, confirming improving momentum. RSI has cooled from prior overbought readings but stabilizes above 50, suggesting dips could stay limited before buyers reassert control.

GBP/USD flat lines as traders await key UK macro data and FOMC minutes

The GBP/USD pair kicks off a new week on a subdued note and oscillates in a narrow range, just below mid-1.3600s, during the Asian session. Moreover, the mixed fundamental backdrop warrants some caution for aggressive traders as the market focus now shifts to this week's important releases from the UK and the US.

Gold slides below $5,000 amid USD uptick and positive risk tone; downside seems limited

Gold attracts fresh sellers at the start of a new week and reverses a part of Friday's strong move up of over $150 from sub-$4,900 levels. The commodity slides back below the $5,000 psychological mark during the Asian session, though the downside potential seems limited amid a combination of supporting factors.

Bitcoin, Ethereum and Ripple consolidate within key ranges as selling pressure eases

Bitcoin and Ethereum prices have been trading sideways within key ranges following the massive correction. Meanwhile, XRP recovers slightly, breaking above the key resistance zone. The top three cryptocurrencies hint at a potential short-term recovery, with momentum indicators showing fading bearish signs.

Global inflation watch: Signs of cooling services inflation

Realized inflation landed close to expectations in January, as negative base effects weighed on the annual rates. Remaining sticky inflation is largely explained by services, while tariff-driven goods inflation remains limited even in the US.

Ripple Price Forecast: XRP potential bottom could be in sight

Ripple edges up above the intraday low of $1.35 at the time of writing on Friday amid mixed price actions across the crypto market. The remittance token failed to hold support at $1.40 the previous day, reflecting risk-off sentiment amid a decline in retail and institutional sentiment.