EURUSD: Neutral -Mildly Bearish

EURUSD: 1.1730
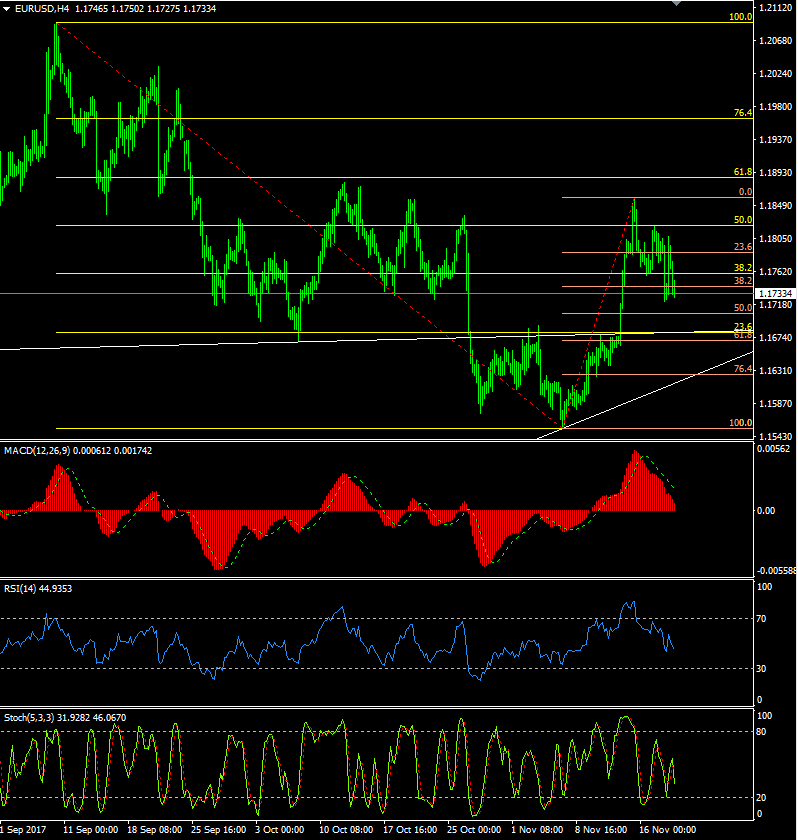
EurUsd had a choppy range of 1.1721/1.1807 care of the German political standoff, leaving Angela Merkel with the possibility of facing new elections.
Focus will again be on Germany today, to see what the next direction will be, and that is likely to weigh on the downside although with the momentum indicators looking mixed it could be another session within the 1.1700/1.1800 range. As we said yesterday, with a fairly limited calendar this week, it looks as though it will be politics and risk sentiment that will continue to guide the action, although the FOMC Minutes may provide something directional on Wednesday.
The short term momentum indicators still look a little heavy and we might see another test of the 1.1721 low, below which could allow a decline towards 1.1700, below which 1.1670/80 would attract. This was the previous H/S neckline and is also the 61.8% Fibo level (1.1670) of the recent rally from 1.1553, and should see decent bids but below which opens the way to 1.1650 and eventually to 1.1625. Having closed back below the 100 DMA (1.1745), I suspect the downside will eventually come good, and today, selling at this level may be a plan.
On the other hand, the daily MACDs still suggest that further gains are possible in the days ahead, and back above the session high of 1.1807 would open up 1.1820/30, which would find good sellers ahead of 1.1855/60 and again at 1.1880/85, beyond which would allow a run towards 1.1900+.
Preferred Strategy: For Tuesday, I prefer to adopt a fairly neutral stance in the absence of any major data but with one eye on headlines from Germany. Out of choice I would look to sell into strength above 1.1745, perhaps towards 1.1780, with a SL placed above 1.1830.
Sell EurUsd @ 1.1770. SL @ 1.1830, TP @ 1.1740.
| 24 Hour: Neutral -Mildly Bearish | Medium Term: Neutral – Prefer to sell rallies | ||
| FX Charts Position: | Short – SL above 1.1880 | ||
| Resistance | Support | ||
| 1.1857/59 | 20 Oct high/16 Nov high | 1.1735 | 100 DMA |
| 1.1828 | Daily cloud base | 1.1721 | Session low |
| 1.1821 | 17 Nov high | 1.1690 | Minor |
| 1.1807 | Session high | 1.1671 | (61.8% of 1.1553/1.1859) |
| 1.1745 | 100 DMA | 1.1660 | 14 Nov low |
Economic data highlights will include:
EU Financial Stability Report, Chicago Fed National Activity Index, US Existing Home Sales , API Weekly Crude Oil Stock Inventory
Author

Jim Langlands
FX Charts
Jim Langlands began his trading career in the commodities markets in London in 1976, before moving to Australia in 1979 to work as a floor trader on the Sydney Futures Exchange.


