EURUSD: Initial resistance will again be seen at 1.2400

EURUSD: 1.2378
EurUsd had a tight 50 point range on Wednesday after the Eurozone CPI was finalised at 1.4% yy in May, core CPI at 1.0% yy, in line with expectations. It could be a similar session ahead, with little data due heading into the weekend with the Philadelphia Fed Mfg Survey being the main focus today along with various Fed speakers.
1 hour/4 hour indicators: Mixed.
Daily Indicators: Neutral
Weekly Indicators: Possible topping formation.
Preferred Strategy: The short term momentum indicators are mixed and fairly neutral again today with another sideways session looking the most likely outcome.
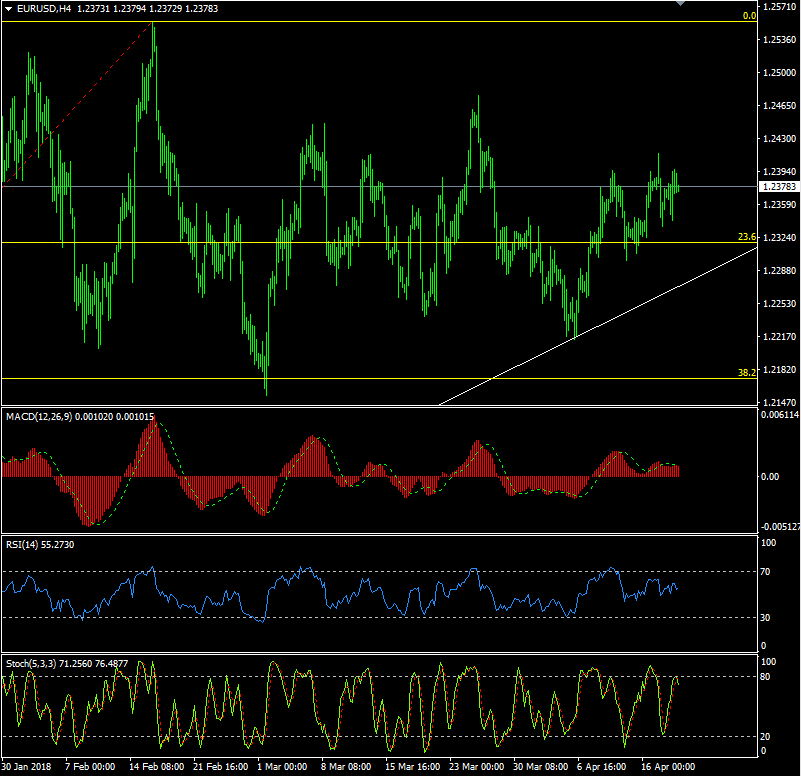
On the downside, the initial support will arrive at the session low at 1.2340 ahead of the 17 Apr low at 1.2335 and the 16 Apr low of 1.2323, where the daily cloud base continues to lend support. Below there could reverse towards 1.2300/05 and then at 1.2260/50, where the rising trend support should remain strong support. Having tried and failed to break below this trend support in trading down to 1.2215 on Apr 6, this area will also remain strong support and this looks likely to hold for a while, although a break of 1.2200 could then head towards Fibo/100 DMA support at 1.2170/75. Below there would target 1.2085 and possibly 1.2025 although this remains over the horizon for now.
On the topside, the initial resistance will again be seen at 1.2400, above which we could then head back towards 1.2415/20 and even towards 1.2470/75. Beyond 1.2500 looks unlikely for now, but if wrong a test of 1.2555, the 16 Feb high could be the eventual result.
As before, I remain fairly neutral while this choppy trade persists, but given the speculative long Euro positioning, I still mildly prefer the downside in the medium term and would look to sell rallies towards the top end of the current range. Right now it seems that we are likely to just chop around within the existing range- Something like 1.21/1.25 – but going nowhere fast. US Retail Sales in focus today.
| Resistance | Support | ||
| 1.2475 | 27 Mar high | 1.2341/35 | Session low/ 17 Apr low |
| 1.2450 | Minor | 1.2327/23 | Daily cloud base/ 16 Apr low |
| 1.2421 | 28 Mar high | 1.2299/1.2306 | 12 Apr low/13 Apr low (Daily Tenkan) |
| 1.2415/13 | (76.4% of 1.2475/1.2215)/16 Apr high | 1.2250 | 9 Apr low/Rising trend support |
| 1.2396 | Session high | 1.2215 | 6 Apr low |
Economic data highlights will include:
EcoFin Meeting, EU Current Account, Philadelphia Fed Mfg Survey, US Jobless Claims, Fed speakers; Brainard, Quarles, Mester
Author

Jim Langlands
FX Charts
Jim Langlands began his trading career in the commodities markets in London in 1976, before moving to Australia in 1979 to work as a floor trader on the Sydney Futures Exchange.


