Short-term EURUSD Elliott Wave view suggests that the pair remains in a sideways triangle range between 1.2554 and 1.2153 levels as mentioned in the previous post here. Until we break out of the range, we look for the sideways price action to continue. Triangle doesn’t have any particular trend, but it is generally a continuation pattern, thus the pair likely thrust higher to continue the previous bullish trend after the sideways action is over. If we take a look at the previous cycle from January 2017 low. The pair shows a higher high sequence thus the pair is favored to trade higher once triangle consolidation is complete. It’s important to note that the Triangle is labeled as A,B,C,D,E.

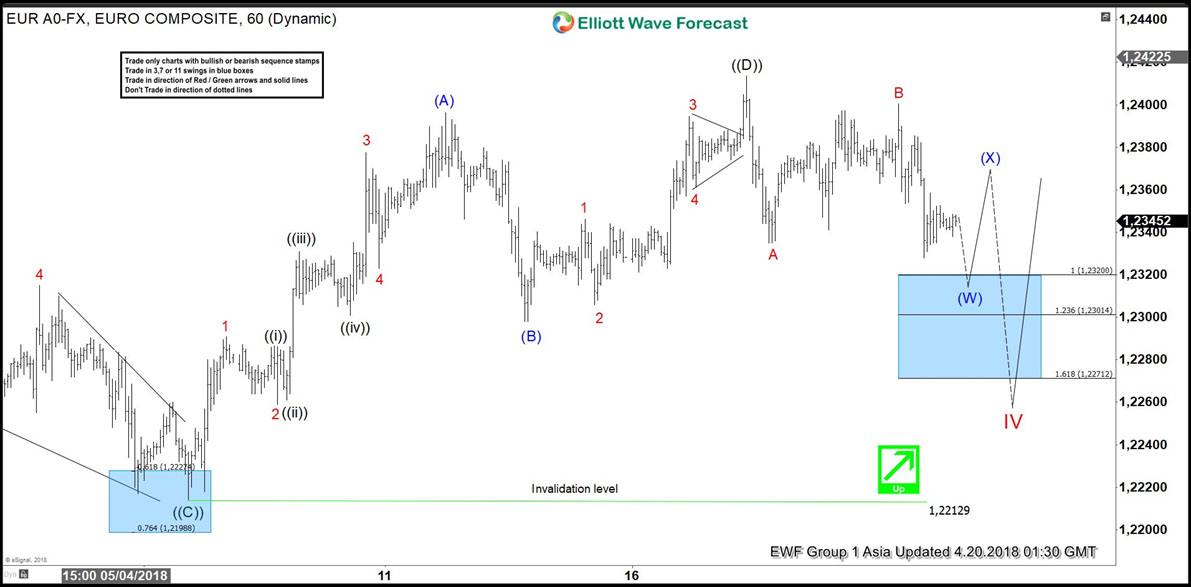
Currently, we can be in the final stage of triangle structure in Cycle degree wave IV where the decline to 1.2214 low ended Primary wave ((C)) of IV. Above from there, wave ((D)) of IV ended at 1.2414 high. The internals of primary wave ((D)) is unfolding as zigzag Elliott Wave structure where Intermediate wave (A) ended at 1.2396. Afterwards, Intermediate wave (B) pullback ended at 1.2298 low and Intermediate wave (C) of ((D)) ended at 1.2414 high. Down from there, Primary wave ((E)) of IV remains in progress as double three Elliott Wave structure looking to end Intermediate wave (W) of ((E)) in 3 swings at 1.2320-1.2301 100%-123.6% Fibonacci extension area of Minor A-B. Pair should then correct in Intermediate wave (X) of ((E)) and ideally fail below 1.2414 for another extension lower before a thrust higher is seen. We don’t like selling the pair.

EURUSD Elliott Wave 1 Hour Chart

EURUSD


Elliott Wave


Become a Successful Trader and Master Elliott Wave like a Pro. Start your Free 14 Day Trial at - Elliott Wave Forecast.

FURTHER DISCLOSURES AND DISCLAIMER CONCERNING RISK, RESPONSIBILITY AND LIABILITY Trading in the Foreign Exchange market is a challenging opportunity where above average returns are available for educated and experienced investors who are willing to take above average risk. However, before deciding to participate in Foreign Exchange (FX) trading, you should carefully consider your investment objectives, level of xperience and risk appetite. Do not invest or trade capital you cannot afford to lose. EME PROCESSING AND CONSULTING, LLC, THEIR REPRESENTATIVES, AND ANYONE WORKING FOR OR WITHIN WWW.ELLIOTTWAVE- FORECAST.COM is not responsible for any loss from any form of distributed advice, signal, analysis, or content. Again, we fully DISCLOSE to the Subscriber base that the Service as a whole, the individual Parties, Representatives, or owners shall not be liable to any and all Subscribers for any losses or damages as a result of any action taken by the Subscriber from any trade idea or signal posted on the website(s) distributed through any form of social-media, email, the website, and/or any other electronic, written, verbal, or future form of communication . All analysis, trading signals, trading recommendations, all charts, communicated interpretations of the wave counts, and all content from any media form produced by www.Elliottwave-forecast.com and/or the Representatives are solely the opinions and best efforts of the respective author(s). In general Forex instruments are highly leveraged, and traders can lose some or all of their initial margin funds. All content provided by www.Elliottwave-forecast.com is expressed in good faith and is intended to help Subscribers succeed in the marketplace, but it is never guaranteed. There is no “holy grail” to trading or forecasting the market and we are wrong sometimes like everyone else. Please understand and accept the risk involved when making any trading and/or investment decision. UNDERSTAND that all the content we provide is protected through copyright of EME PROCESSING AND CONSULTING, LLC. It is illegal to disseminate in any form of communication any part or all of our proprietary information without specific authorization. UNDERSTAND that you also agree to not allow persons that are not PAID SUBSCRIBERS to view any of the content not released publicly. IF YOU ARE FOUND TO BE IN VIOLATION OF THESE RESTRICTIONS you or your firm (as the Subscriber) will be charged fully with no discount for one year subscription to our Premium Plus Plan at $1,799.88 for EACH person or firm who received any of our content illegally through the respected intermediary’s (Subscriber in violation of terms) channel(s) of communication.

Recommended Content


Recommended Content

Editors’ Picks

AUD/USD pressures as Fed officials hold firm on rate policy

AUD/USD pressures as Fed officials hold firm on rate policy

The Australian Dollar is on the defensive against the US Dollar, as Friday’s Asian session commences. On Thursday, the antipodean clocked losses of 0.21% against its counterpart, driven by Fed officials emphasizing they’re in no rush to ease policy. The AUD/USD trades around 0.6419.

AUD/USD News

EUR/USD extends its downside below 1.0650 on hawkish Fed remarks

EUR/USD extends its downside below 1.0650 on hawkish Fed remarks

The EUR/USD extends its downside around 1.0640 after retreating from weekly peaks of 1.0690 on Friday during the early Asian session. The hawkish comments from Federal Reserve officials provide some support to the US Dollar.

EUR/USD News

Gold price edges higher on risk-off mood hawkish Fed signals

Gold price edges higher on risk-off mood hawkish Fed signals

Gold prices advanced late in the North American session on Thursday, underpinned by heightened geopolitical risks involving Iran and Israel. Federal Reserve officials delivered hawkish messages, triggering a jump in US Treasury yields, which boosted the Greenback.

Gold News

Runes likely to have massive support after BRC-20 and Ordinals frenzy

Runes likely to have massive support after BRC-20 and Ordinals frenzy

With all eyes peeled on the halving, Bitcoin is the center of attention in the market. The pioneer cryptocurrency has had three narratives this year already, starting with the spot BTC exchange-traded funds, the recent all-time high of $73,777, and now the halving.

Read more

Billowing clouds of apprehension

Billowing clouds of apprehension

Thursday marked the fifth consecutive session of decline for US stocks as optimism regarding multiple interest rate cuts by the Federal Reserve waned. The downturn in sentiment can be attributed to robust economic data releases, prompting traders to adjust their expectations for multiple rate cuts this year.

Read more

Majors

Cryptocurrencies

Signatures