EUR/USD continues to trade within tight boundaries, gold stays within bearish channel

EUR/USD continues to trade within tight boundaries
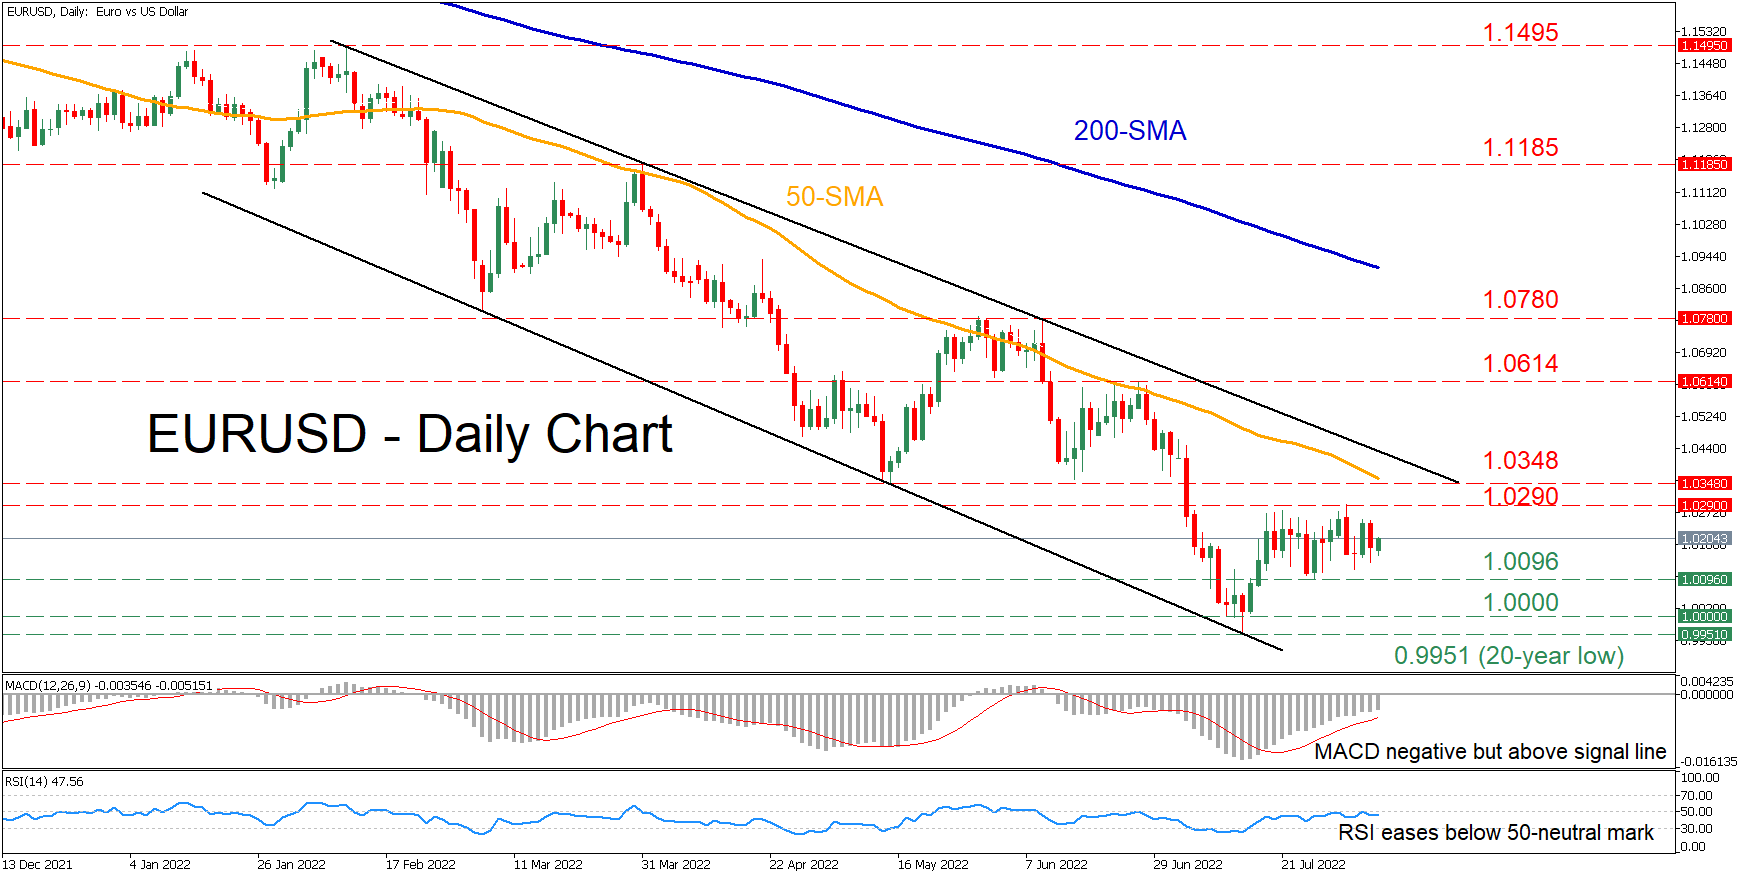
EURUSD has been trading sideways for three weeks after the price managed to rebound from the 20-year low of 0.9951. In addition, the pair is currently standing below both its descending 50- and 200-day simple moving average (SMAs), endorsing a broader bearish technical picture.
The momentum indicators suggest that near-term risks are tilted to the downside. Specifically, the MACD histogram remains in the negative territory but above its red signal line, while the RSI is flatlining beneath its 50-neutral mark.
Should negative momentum strengthen, the pair could descend to test the 1.0096 barrier. Sliding beneath that floor, the spotlight may turn to parity, which is considered a crucial psychological mark by markets. A violation of the latter could pave the way for the 20-year low of 0.9951.
On the flipside, upside pressures could send the pair to test 1.0290, which is the upper boundary of its recent rangebound pattern. Piercing through this region, the bulls might aim for 1.0348 before the 1.0614 peak appears on the radar. Even higher, 1.0780 could prove to be a tough obstacle for the price to overcome.
In brief, even though EURUSD has merely recovered, the price action remains within its long-term descending channel. Therefore, for the sentiment to reverse, the pair needs to initially escape its bearish pattern to the upside.
Gold stays within bearish channel
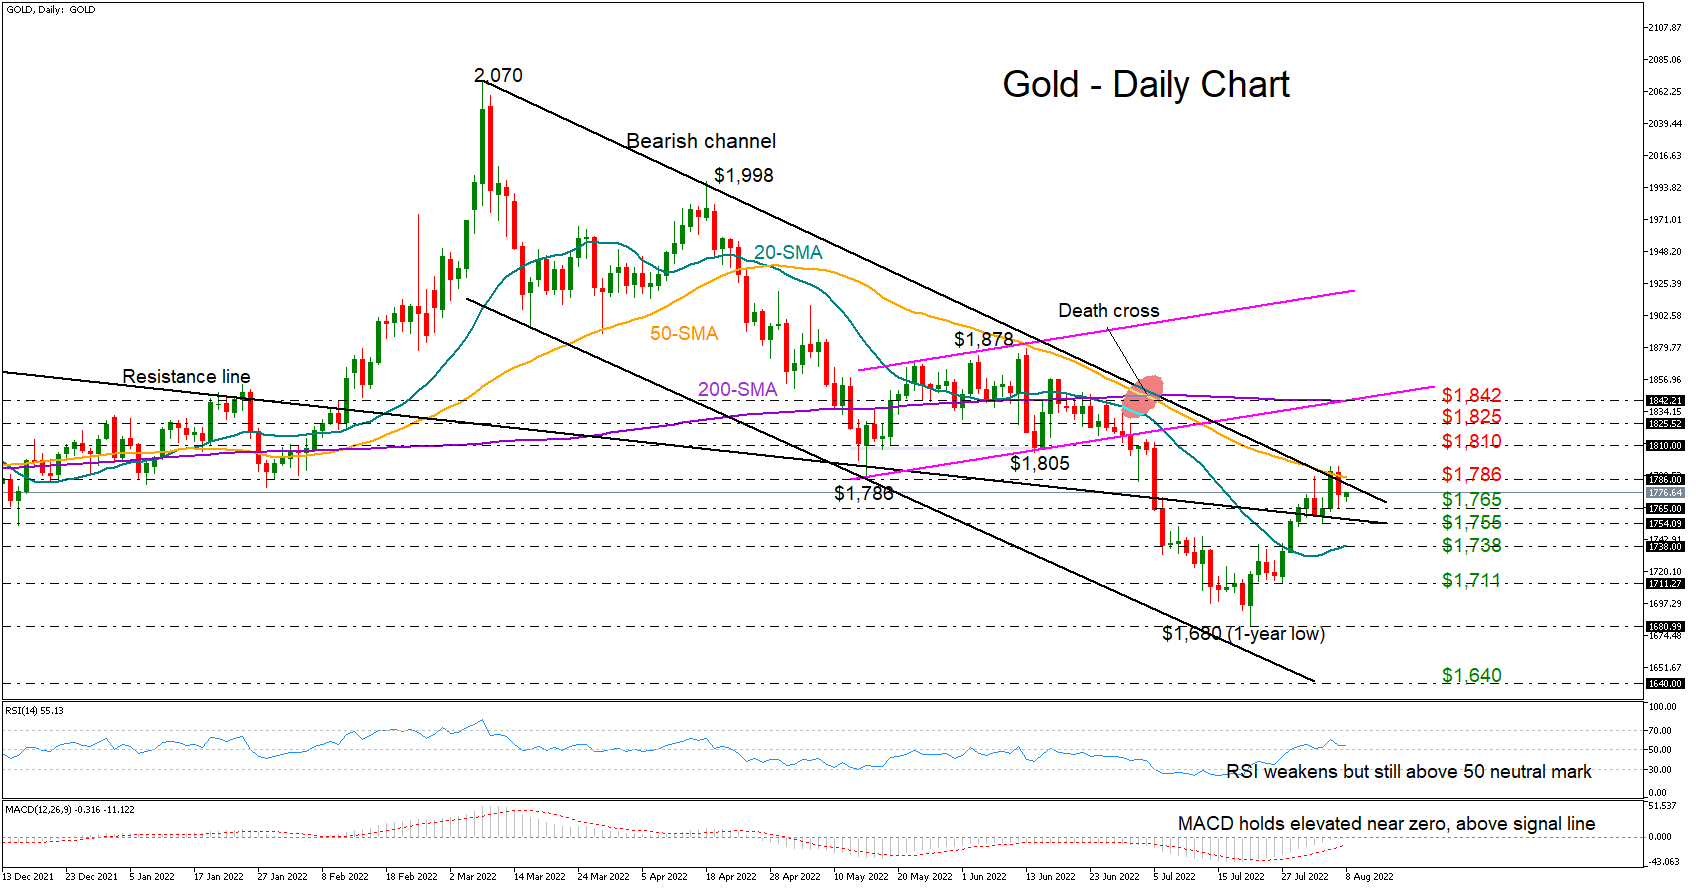
Gold was trading with a muted tone during Monday's early European trading hours at $1,774 following the pullback near the 50-day simple moving (SMA) and the surface of the downward-sloping channel last Friday.
The latest decline raised concerns about whether a new downturn will start within the bearish channel, but the momentum indicators have yet to clarify this. Although losing steam, the RSI is still above its 50 neutral mark, while the MACD remains attached around zero and marginally above its red signal line, both reflecting a neutral short-term bias instead.
Should selling pressures resurface, the $1,765 - $1,755 region could again come immediately to the rescue. If it fails to block the way down, the spotlight will turn to the 20-day SMA at $1,738, while lower, the bears will aim to breach the $1,711 restrictive region in order to meet the one-year low of $1,680.
Alternatively, the bulls may retry to raise their fortune above the channel’s upper boundary and the 50-day SMA at $1,786. If they succeed this time, buying interest could grow towards the $1,810 - $1,825 zone. The 200-day SMA at $1,842 could be a more critical target.
In brief, despite Friday’s failure to exit the bearish channel, gold has yet to motivate selling practices. A break below $1,758 could make a downside reversal more likely.
Author

Stefanos joined XM as a Junior Investment Analyst in September 2021. He conducts daily market research on the currency, commodity and equity markets, from a fundamental and a technical perspective.


