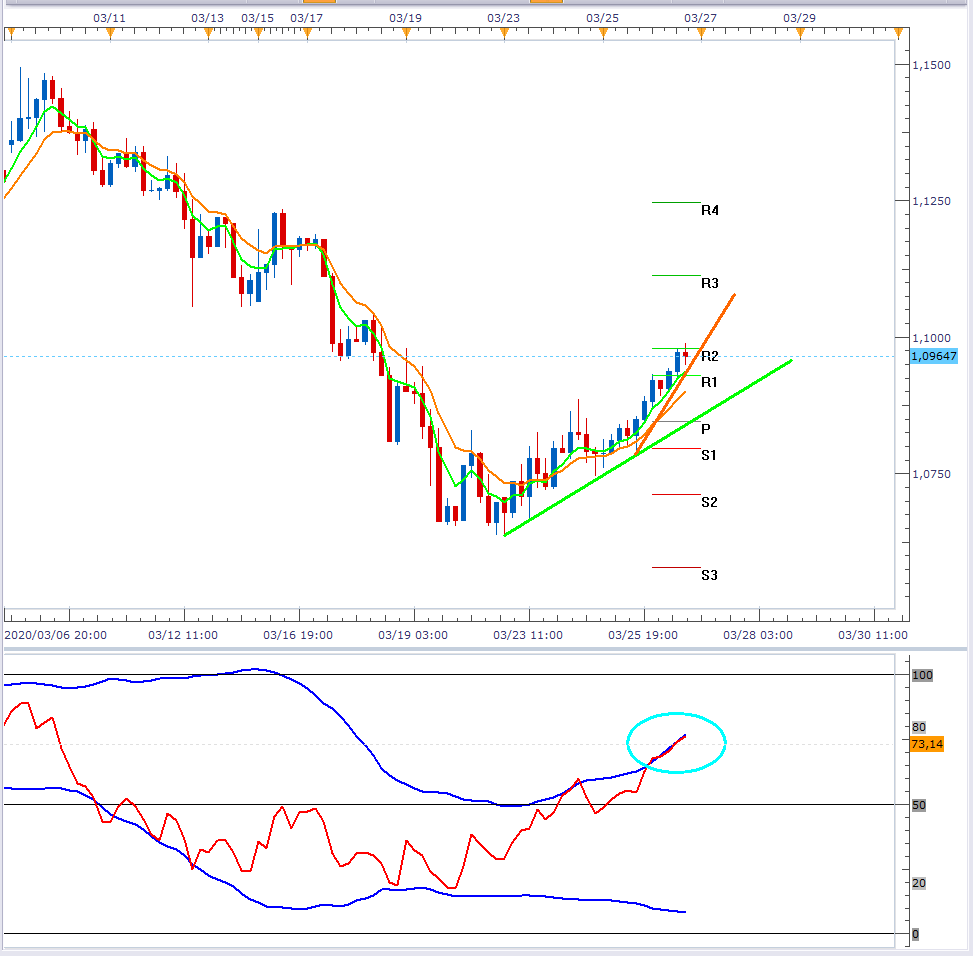
EUR/USD appreciation accelerates but pull-back may be due
The chart below shows the H4 time frame of EURUSD. The currency pair appreciated following the Fed’s announcement of unlimited QE. We note that the appreciation has actually subsequently accelerated. This can be seen by the shift in gradient from the green trend line to the steeper orange trend line gradient. The RSI is also on the positive side of 50 and denotes an underlying bullish momentum However, the oscillator has topped the relative overbought line (aqua ellipse). Thus, we may see a pull-back as the indicator normalises; this might provide a "buy the dip" opportunity.
Past performance is not an indicator of future results
CHART SOURCE: FXCM MARKETSCOPE 2.0
Author

Russell Shor (MSTA, CFTe, MFTA) has an Honours Degree in Economics from the University of South Africa and holds the coveted Certified Financial Technician and Master of Financial Technical Analysis qualifications from the Interna


