Euro under pressure as uncertainty hits German politics

Market Overview
The euro has come under renewed pressure as European political risk has increased, with coalition talks to form the next German government having collapsed over the weekend. There is now a very real possibility that Angela Merkel may lose her position as German Chancellor with the prospect of new German elections increasingly likely. This may be some way off happening for now, but the markets are reacting. German Bund yields may have only slipped around 1 basis point; however German equities are underperforming today and the euro has dropped by just under half a percent against the dollar and the yen early today and is now in danger of unwinding the recovery of recent weeks. The euro is though not the only major currency under pressure as falling Treasury yields are hitting the dollar. A sharp fall on Friday came amid concerns over the time line of tax reform slipping into next year continues to hamper US yields. The yield curve subsequently continues to flatten, with the 2s/10s spread ever tightening, now below 62 basis points.

Wall Street closed back lower, with the S&P 500 -0.3% at 2579, whilst Asian markets took this lead this morning with the Nikkei -0.6% lower certainly not helped by the recent yen strength. European markets are taking the added uncertainty of German politics and begin the new weeks on the back foot, with the DAX under the most pressure. In forex trading, the dollar still looks to be under pressure, although the euro is the big underperformer of the day. In commodities, gold has pared some of its gains from Friday, whilst oil is consolidating after its own sharp upside move at the end of last week.
The week starts on a quiet note today with no major economic data announcements. The one major factor to watch is a speech by ECB President Mario Draghi at 1400GMT.
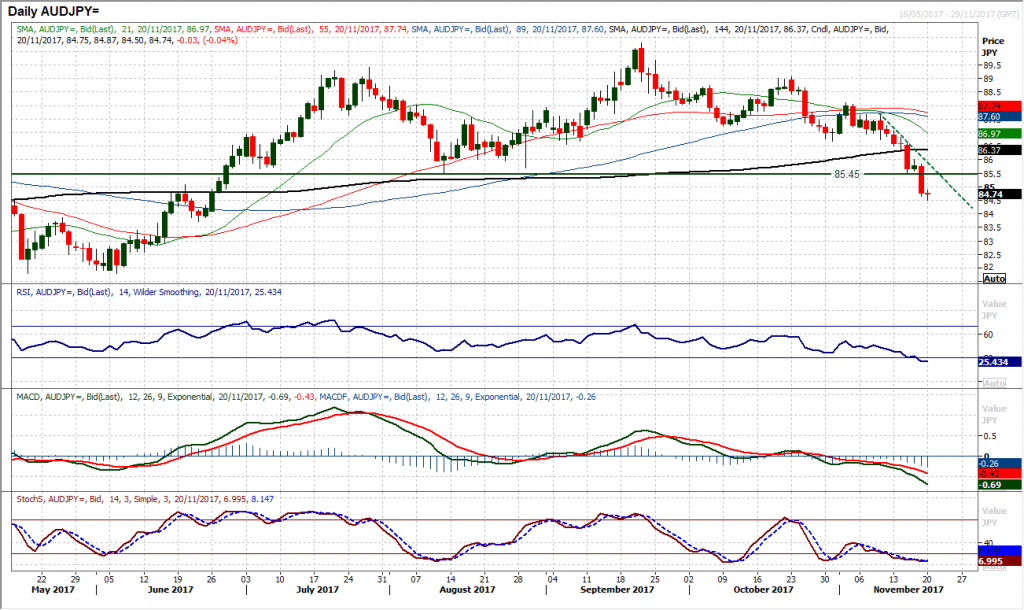
Chart of the Day – AUD/JPY
Aussie/Yen is considered to be a big indicator for risk appetite. The huge breakdown below the key August low at 85.45 completes a big double top pattern and opens for a bigger correction now. The implied downside target is around 400 pips in the coming 4 months now towards 81.50 which also happens to be the key April low. The momentum indicators are certainly reflective of a significant deterioration with the RSI moving below 25 to a 7 month low, whilst the MACD lines are accelerating at a six month low below neutral. The concern for the bulls is that this seems to be a fairly dynamic downside break and the market is running, so any intraday rebounds are likely to now be seen as a chance to sell. The 85.45 old support now becomes a basis of new resistance and the hourly chart shows resistance between 85.00/85.50. The hourly indicators show a potential rebound today but it is likely to be short-lived. Initial support is today’s low at 84.50 whilst the June low at 83.70 is next up.
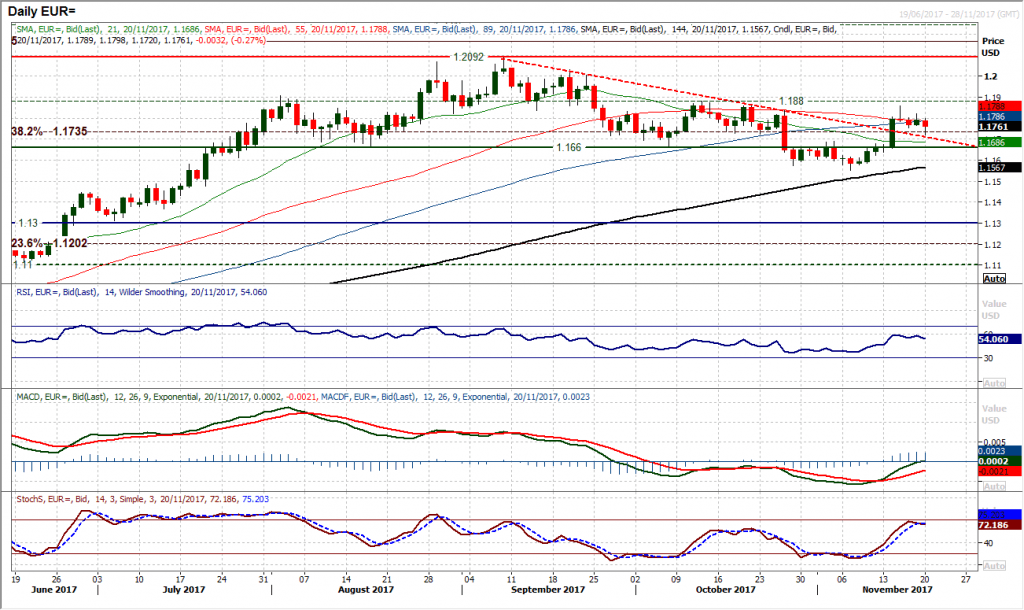
EUR/USD
How is the euro reacting to the potential for Angela Merkel losing her position as Chancellor of Germany? So far in early Asian trading, the market has dropped around 60 pips. Nothing then to derail the recent recovery, yet. The bulls will be looking at a band of support $1.1660/$1.1730 as an important gauge of sentiment now. The 38.2% Fibonacci retracement of $1.3992/$1.0340 at $1.1735 is also an interesting basis of support. A loss of support at $1.1660 would be a confirmed deterioration now though as this is the neckline that the bulls fought so hard to break above last week. The momentum indicators have turned over this morning too. Watch the hourly chart which shows the hourly RSI and Stochastics back at levels where the sellers are on the brink of gaining control today (around 30 on RSI and around 20 on Stochastics). Initial support is $1.1720 from the knee jerk overnight drop. Resistance is now at $1.1775/$1.1800.
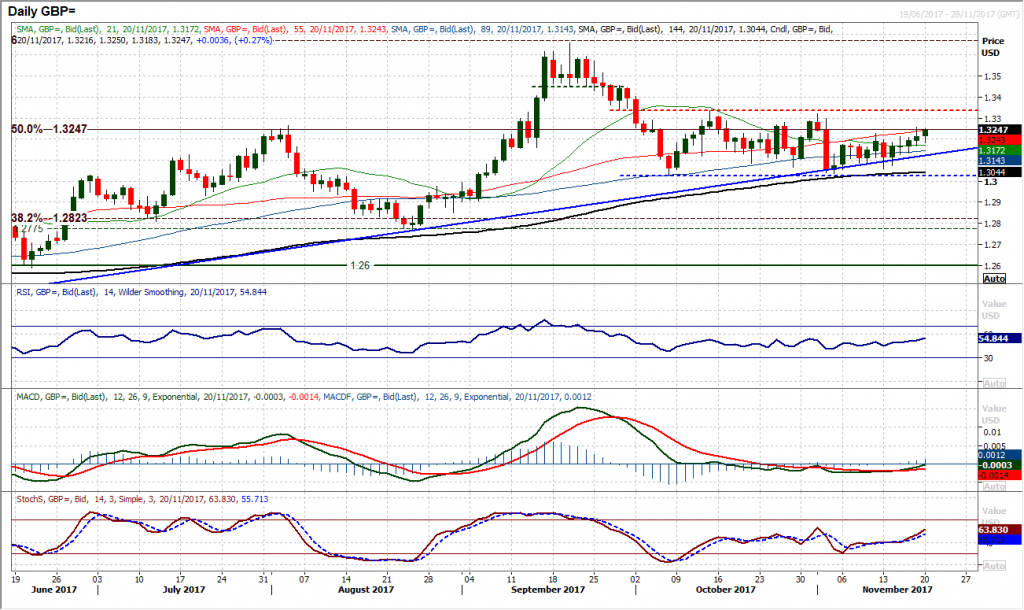
GBP/USD
After teetering on the brink of a breakdown of the long term uptrend, the bulls have pulled away again. The market has bolstered the six week range and is looking to build for a move towards the highs. However, there is a lack of conviction in the move which still suggests the bulls are not ready to make a serious challenge on the range highs at $1.3335. Small candle positive bodies show the positive outlook but are tentative. The momentum indicators have ticked higher but are by no means calling for a breakout. The hourly RSI and MACD lines are positively configured but the higher low at $1.3167 now needs to hold and a push above Friday’s high of $1.3260 needs to be seen soon to continue to the recovery momentum.
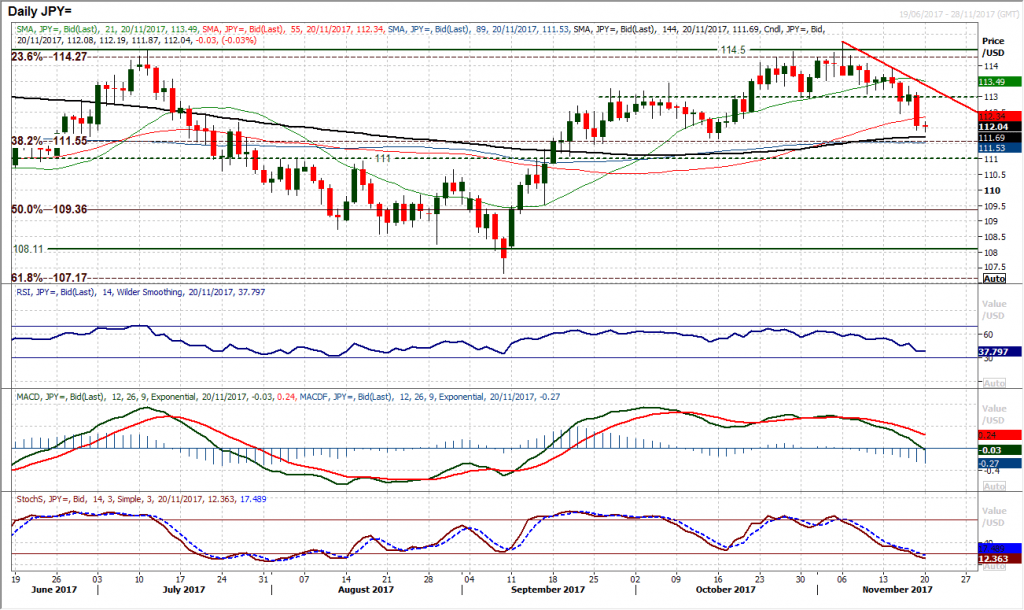
USD/JPY
The breakdown from the small top pattern implies around 150 pips of downside measured from the 112.95 neckline. The strong bear candle from Friday shows that the market is well on course for that now. This was the largest one-day decline on USD/JPY since 6th June and really does increase the pressure on the 111.65 key October low. The momentum indicators are accelerating lower and if there is a closing breach of 111.65 then the market will be in full correction mode. The hourly chart shows a series of lower highs and lower lows with rallies being sold into. It is interesting to see an old pivot band 112.20/112.30 as a basis of resistance. Beyond there is minor resistance at 112.70 before the neckline at 112.95 again. The hourly RSI is now failing in the 50/60 area with MACD lines failing around neutral on the rallies.
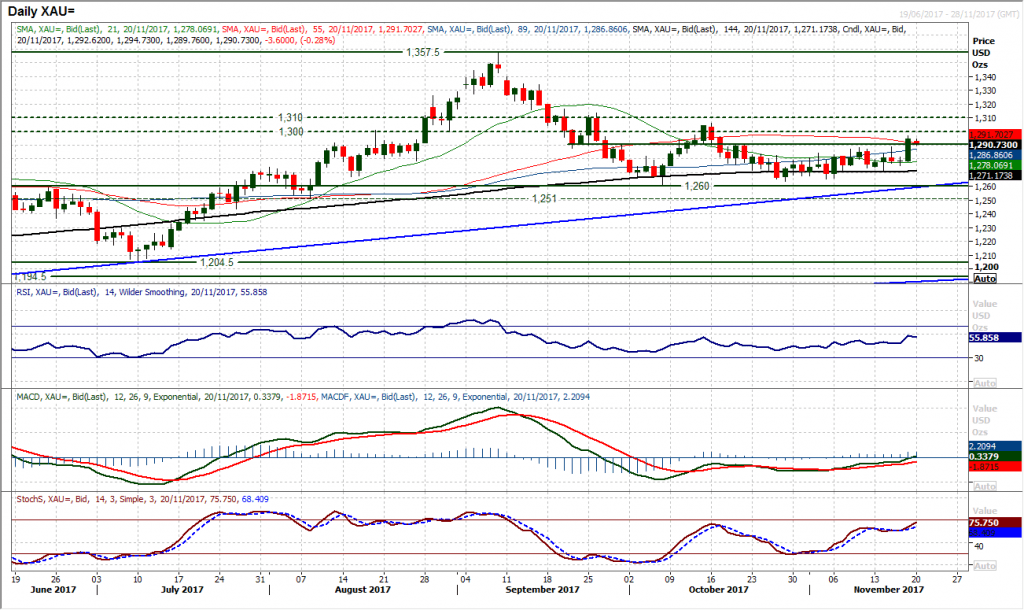
Gold
Gold posted the largest one day gains since the end of August on Friday with an impressively strong bull candle. The question is now whether the bulls can sustain the move as the long term pivot band resistance at $1300/$1310 comes into close proximity. For several weeks the market has been so tentative in its trading which has crept mildly higher on a net basis. Now that we have seen a breakout, can the bulls really take control? Since the market topped out at $1357.50 in September, the technical rallies have floundered at lower levels and on each occasion with the basis of resistance being the long term pivot $1300/$1310. The breakout above $1291 gives another opportunity but the initial signs today are a touch disappointing. The breakout needs confirmation of another bull candle, which is struggling initially. Daily momentum indicators are hinting at a positive move but nothing with ay conviction yet. The hourly chart does show a breakout support around $1288 and a low around here today would be positive still. Whereas if $1282 breaks as support then the impetus will be entirely lost.
WTI Oil
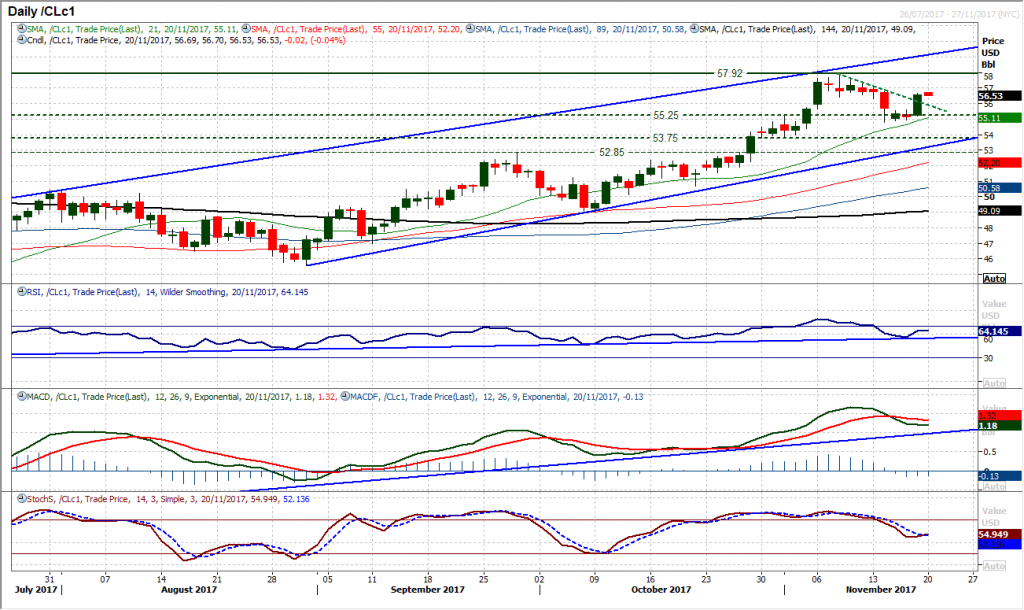
After correcting back over the past week, the oil price got a shot in the arm on Friday. The strong bull candle seems to have breathed some life back into WTI. The question is whether the move is going to sustain a break of the recent corrective move. The recent downside has always been considered to be a correction within the uptrend channel of the past few months and the bulls will have been waiting for their opportunity to move back in. The support has formed at $54.80 which is in the middle of the $53.75/$55.25 old breakout range, whilst momentum indicators turning higher again around multi-month uptrend support levels on the RSI and MACD lines suggests that this could be the limit of the correction now. The market now needs to hold a break back above the initial resistance at $56.40/$57.35 to move once more on the key resistance at $57.92. With the hourly indicators stretched there could now be an initial drop back today but that needs to hold support at $55.60/$55.80 to maintain the improvement.
Dow Jones Industrial Average
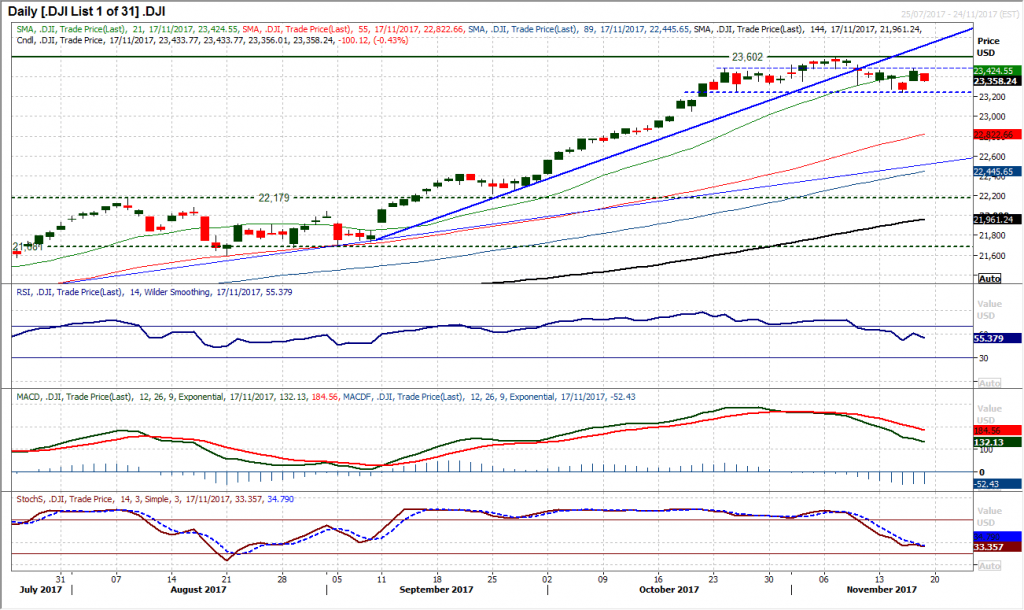
The sharp rebound on Thursday helped to maintain the key support around 23,250 but seems to have failed around the pivot at 23,485. A second decline of over 100 ticks in just three sessions and negative candle does little to suggest that the bulls are out of the woods of this prospective correction. If the move continues lower again today the spectre of a four week top pattern resurfaces. Momentum indicators are certainly still corrective with the RSI tracking lower under 60 and the MACD lines also in decline. The resistance is now growing at 23,492 and this could be a right hand shoulder of a head and shoulders top. The hourly chart reflects the RSI falling over around 60 which is a concern too. Closing a gap at 23,345 would increase the downside pressure today.
Author

Richard Perry
Independent Analyst


