EUR/JPY steps on familiar support zone, GBP/USD returns above 1.2100

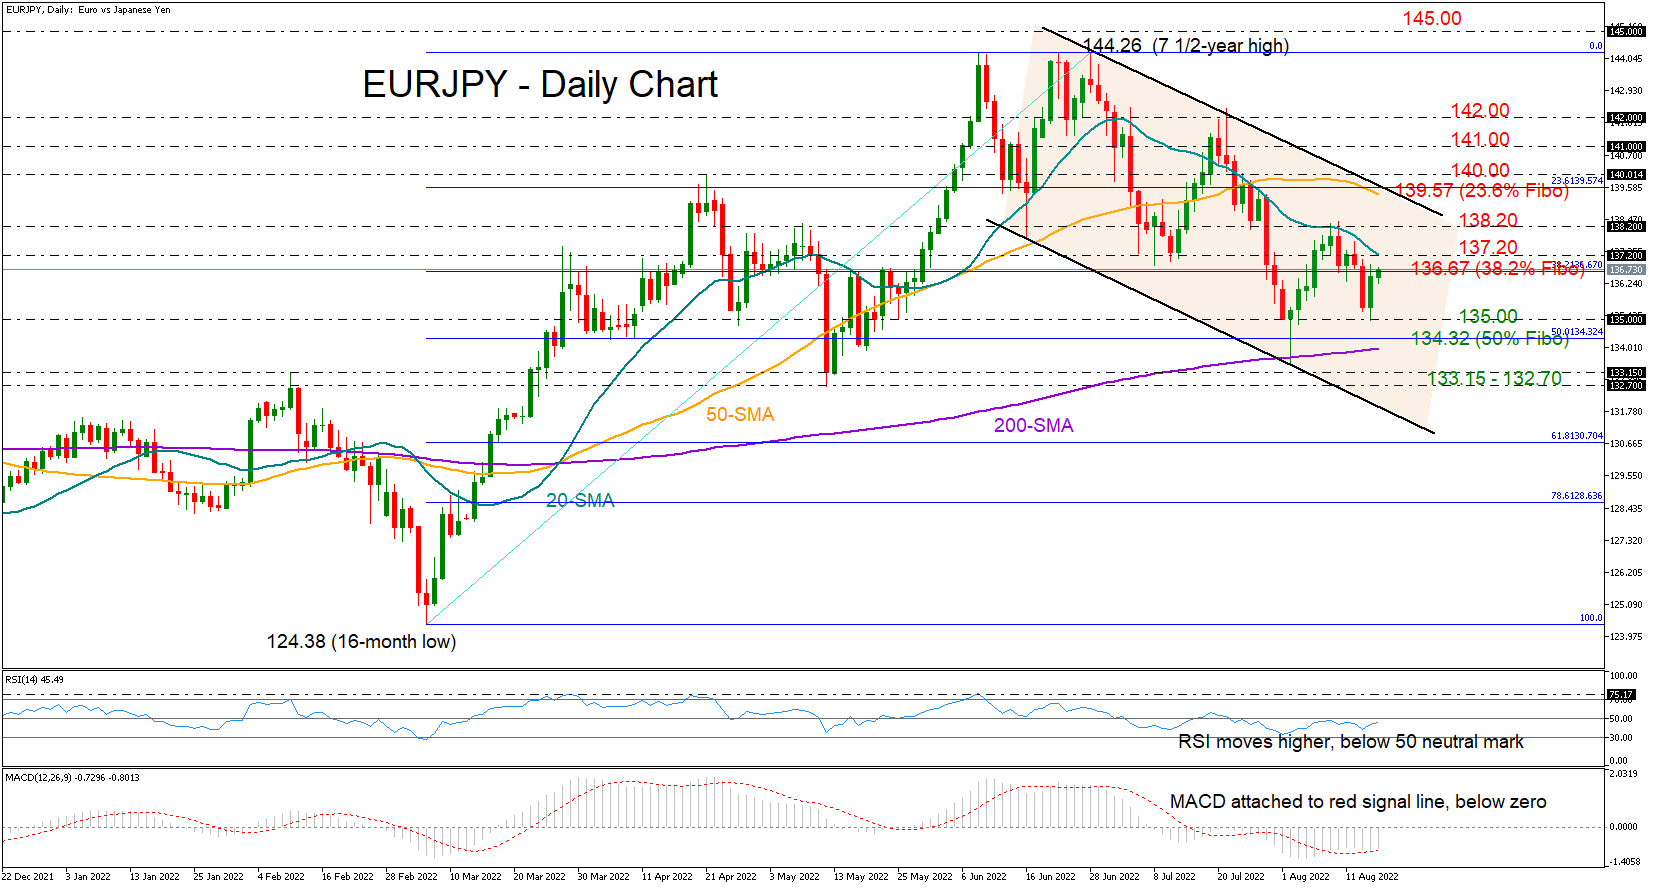
EUR/JPY steps on familiar support zone; 20-SMA in target
EURJPY stood firm again around the 135.00 support region on Tuesday, which triggered the preceding bullish wave, increasing hopes that the latest bearish correction has found a bottom.
The tough 20-day simple moving average (SMA), however, is still overhead, keeping downside risks alive at 137.20, while the 38.2% Fibonacci of the 124.38 – 144.26 upleg also seems a struggle to overcome today as it lies slightly lower at 136.67.
In other discouraging signs, the RSI and the MACD, although having pivoted northwards, remain within the negative area, with the former below its 50 neutral mark and the latter attached to its red signal line below zero.
Unless the bulls sustain their strength above 137.20, the price could flip back to test the 135.00 base. Failure to bounce here this time may initially see an extension towards the 50% Fibonacci of 134.32 and the 200-day SMA, and then a continuation towards the key constraining zone of 133.15 -132.70. Should selling pressures persist at this point, all eyes will turn to the channel's lower boundary at 131.86.
In the bullish scenario, where the pair finally closes above the 20-day SMA, the first obstacle could pop up around 138.20. A decisive step higher may run until the channel’s surface and the 50-day SMA at 139.42, where the 23.6% Fibonacci is also positioned. Beyond that, the 140.00 psychological mark, which halted April’s upside sequence, could immediately block the way towards the 141.00 and 142.00 round levels.
Summarizing, EURJPY seems to have set the stage for its next upside reversal, though whether it will be successful may depend on the restrictive 20-day SMA.
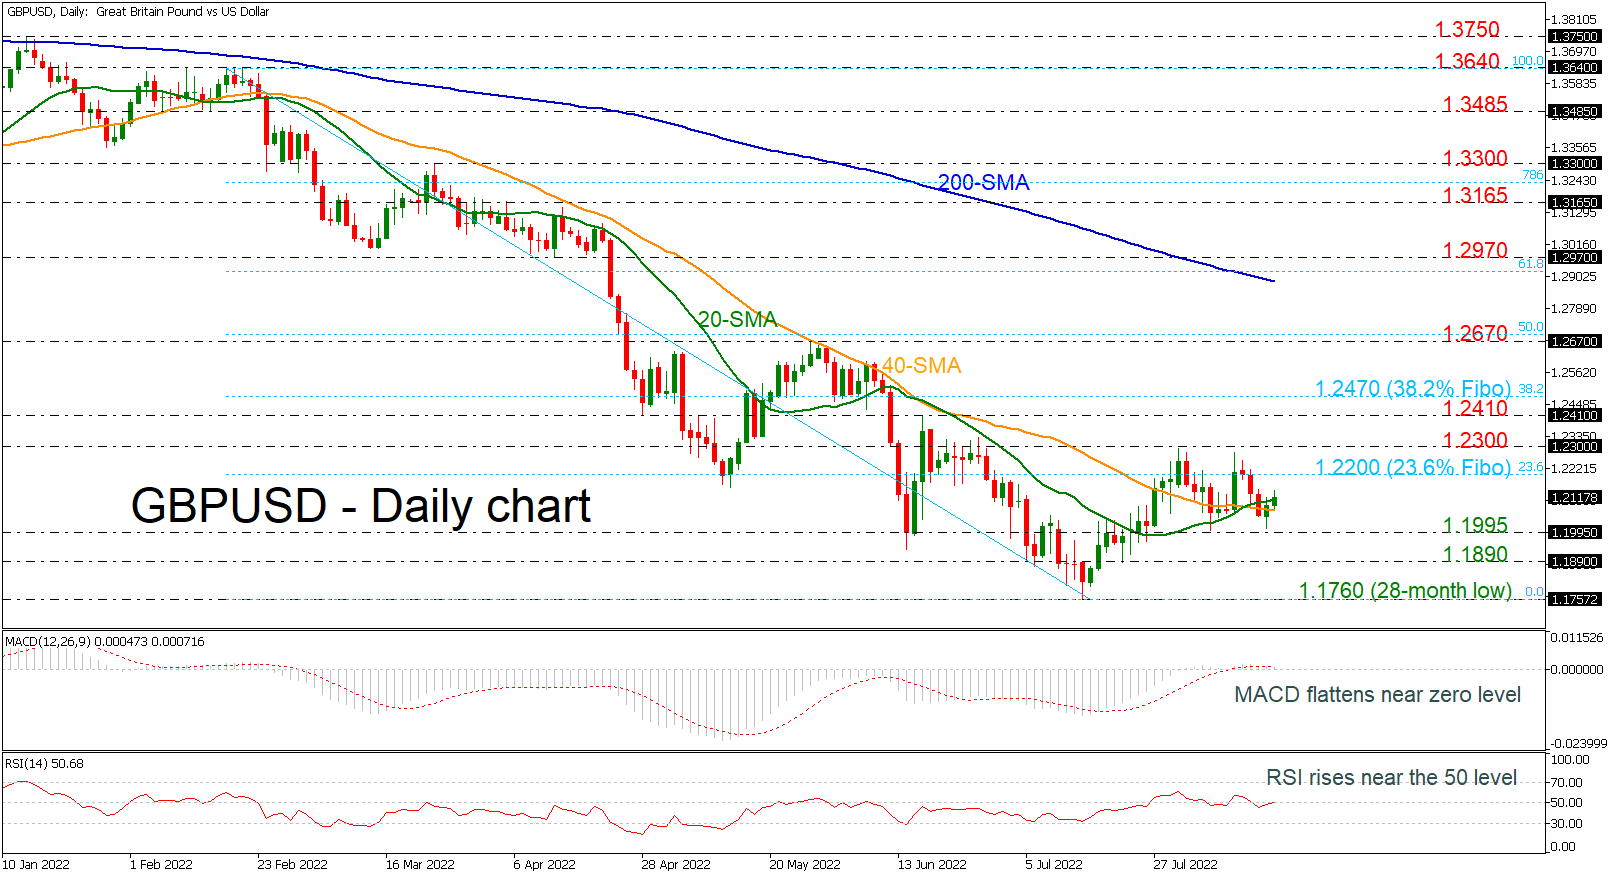
GBP/USD returns above 1.2100; bullish cross within SMAs remains intact
GBPUSD rebounded off the 1.2000 psychological level in the preceding session, flirting with the 20- and 40-day simple moving averages (SMAs). The bullish crossover within the SMAs remains intact, suggesting that a bullish correction may be on the radar in the short-term timeframe. The MACD oscillator is moving sideways near its trigger and zero lines, while the RSI is approaching the neutral threshold of 50.
If the market manages to gain momentum, the 23.6% Fibonacci retracement level of the decline from 1.3640 to 1.1760 at 1.2200 may act as nearby resistance ahead of the 1.2300 barrier. A sustained close above the latter may pave the way for 1.2410 and the 38.2% Fibonacci level at 1.2470.
On the other hand, a move lower again may find next support at 1.1995, a level that has acted as both resistance and support throughout the month of July and the beginning of August. When that level is broken, the next potential support is at 1.1890, after which the attention can turn to the 28-month low at 1.1760.
Since prices are still below the 1.2200 resistance, the medium-term picture is unfavorable and only a successful climb above the 200-day SMA may switch the outlook to bullish.
Author

Christina joined the XM investment research department in May 2017. She holds a master degree in Economics and Business from the Erasmus University Rotterdam with a specialization in International economics.


