EUR/JPY: Classic charting pattern

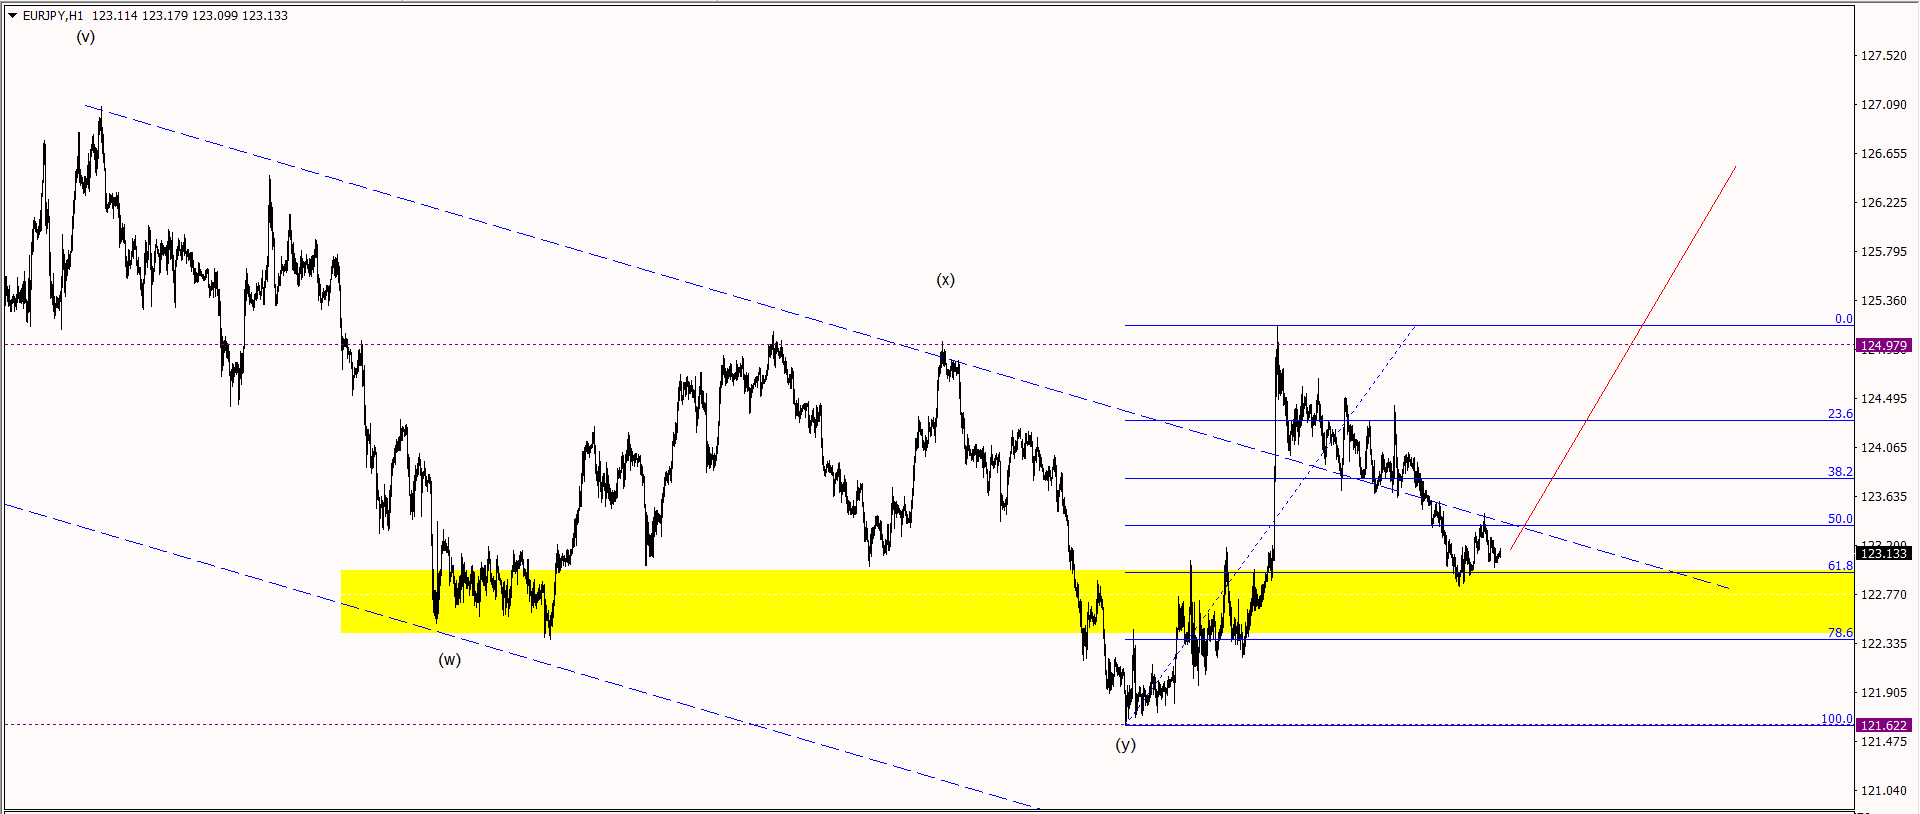
The chart below shows EUR/JPY has been in a complex correction since the 1st of October 2020. The correction is marked as a wxy pattern.
Since we completed the move lower in (y) at 121.622, we have moved higher in an impulsive manner back above the (x) wave high at 124.979, since then we have pulled back lower and, we are now testing the 61.8 Fibonacci level.
The yellow zone shows wave (w) has the left shoulder and the current move lower as the possible right shoulder with wave (y) as being the head. This is a classic head and shoulders pattern which signals upside pressure on this pair.
We are looking for an impulsive move higher to retest at minimum the previous highs at 124.979 and a retest of 127.000.
Key News events this week: ECB Financial Stability Review Wednesday 25th of November.
Res: 123.635; 124.065; 124.495
Sup: 122.335; 121.905; 121.622
Author

Mthokozisi Mpofu
Knars Capital
Mthokozisi Mpofu is the Managing Director of Knars Capital Pvt Ltd, an investment advisory firm helping African SMEs secure growth capital and become investor-ready.


