EURGBP ends the bearish correction

The last time we were analysing the EURGBP it was on the 23th of October. Back then we saw a short-term sell signal there, which was mostly caused by the bearish bounce from the 50% Fibonacci. That was spot on as after our analysis, the price went lower and reached our estimated target. Let us see how the situation looks like after few weeks.
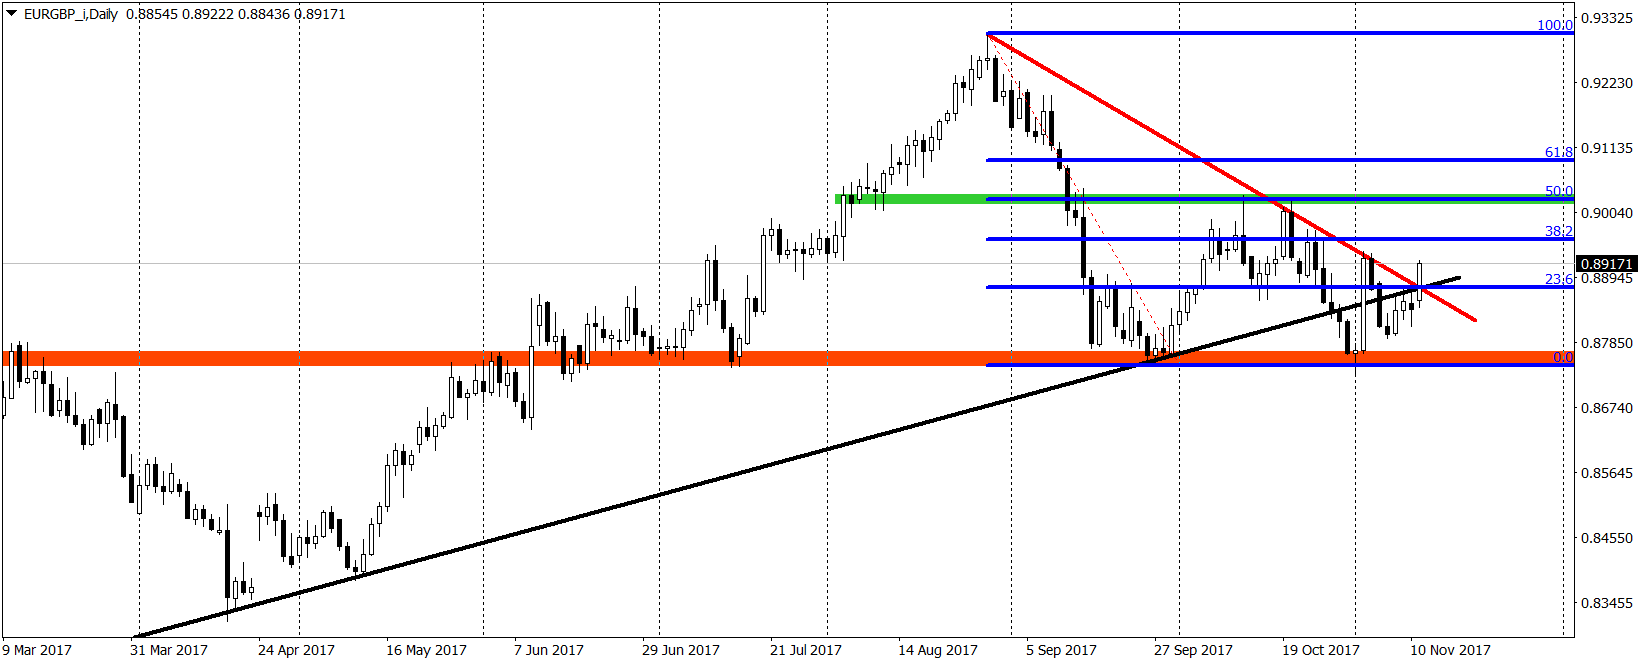
Currently the main sentiment is bullish again. That bearish movement ended and was only a correction. The price used the ultra strong support on the 0.877 (red) to come back to the main bullish trend. Today we add one more bullish checkpoint to the list – breakout of the mid-term down trendline (red). What is more, the price is coming back above the long-term up trendline (black). All that together is very positive and can be perceived as a buy signal.
There is only one 'if' here. This outlook is based on the daily chart and the daily candlestick breaking those resistances. The thing is that we are exactly in the middle of the day (the European session is still open) and still everything can happen (sellers can attack creating a long tail). So to be safe, traders should wait for this D1 candlestick to close. When we will close, around the current levels, above those resistances, the buy signal will be triggered and there should be no more doubts there. At least from the technical point of view...
Author

Tomasz Wisniewski
Axiory Global Ltd.
Tomasz was born in Warsaw, Poland on 25th October, 1985.


