EURCHF on track to retrace 2015 SNB move

Market Recap
|
Market Recap |
% |
Close Price |
|
USDRUB |
1.80% |
60.4639 |
|
EURUSD |
1.12% |
1.1798 |
|
USDTRY |
0.40% |
3.8862 |
|
USDZAR |
-0.69% |
14.3702 |
|
USDCHF |
-0.70% |
0.9893 |
|
UKOIL(Jan.2018) |
-1.50% |
62.21 |
Prices as of previous day instrument closing.
-
Yesterday EURUSD made a significant rebound as the pair rose 130 pips and broke several important static and dynamic resistances. While EURUSD was trending higher since the European session GBPUSD had a more volatile day as the pair slid to 1.3074 during CPI data release and then rose to 1.3185. GBPUSD closed yesterday at 1.3165, up +0.37%. EURTRY closed at record high at 4.5862, with a +1.52% rally. USDJPY slid to 113.46, losing -0.14% and USDCHF dropped to 0.9893, down -0.7%.
-
FTSE MIB led European stocks lower on Tuesday, followed closely by the IBEX35 and Euro Stoxx 50. The Italian equity index closed 0.63% lower as European stocks fell for a sixth straight day weighed by a strong euro. A slump in oil dragged energy stocks down which were among the worst performers. US equity indices closed in negative territory. DJIA slid 30.23 points or -0.13% to 23,409 while the Nasdaq Composite lost 19.72 points or -0.29% to 6,737.87. S&P500 closed at 2,578.87, down 5.97 points or -0.23%.
-
A Bloomberg commodity index recorded its biggest slump in 6 months as WTI Crude fell below $56 per barrel and Brent under $62.
-
BP shares fell 0.77% in London, but Deutsche Bank recovered to close 0.62% higher.
Chart of the day: EURCHF (daily timeframe)
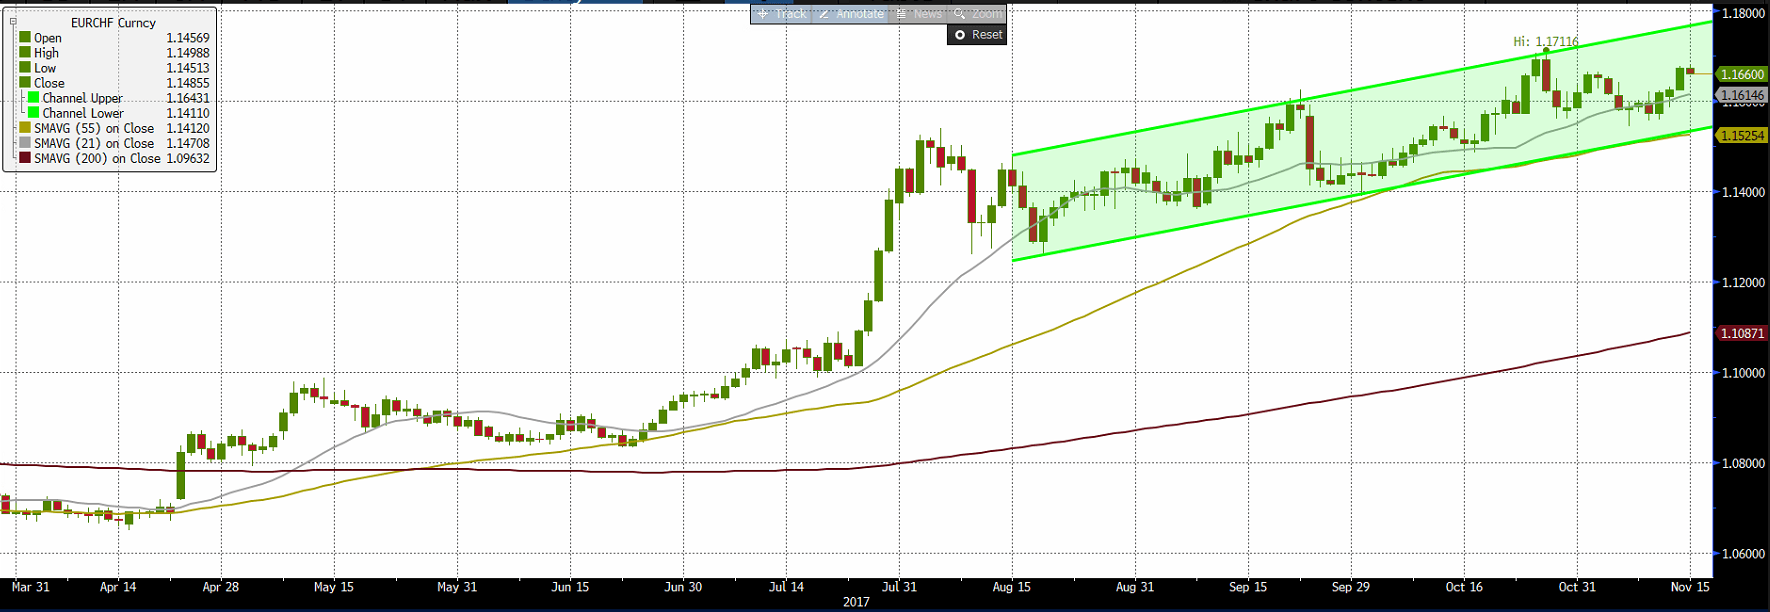
The pair developed a bullish channel and in case of a breakout of the higher side EURCHF could be projected near 1.20, a 100% retracement of the Swiss National Bank event of January 2015. The channel has a width of 230 pips thus below the lower side of the channel EURCHF is supposed to drop at least 230 pips.
EURCHF (weekly timeframe)
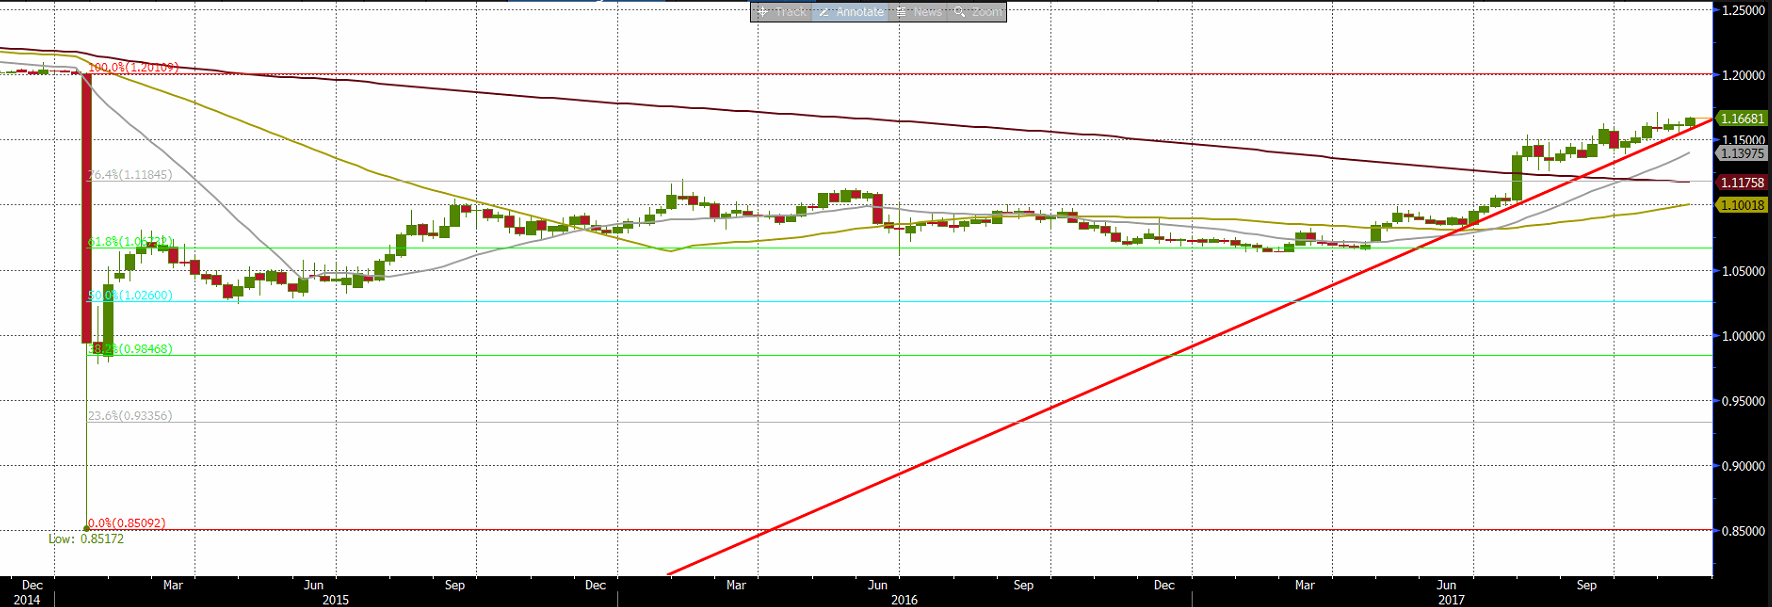
EURCHF retraced the most important technical levels and the next test could be area 1.20. While Switzerland Real GDP (Annual YoY%) for this year is expected at +0.90% the forecast for the next year is for a +1.7%. Exchange rate expectations could have a role. CPI is quite low at 0.7% and Unemployment rate is at 3.1%.
ECONOMIC CALENDAR
|
Wednesday November 15, 2017 CET Time |
Forecast |
Previous | ||
|
10:30 |
GBP |
Average Hourly Earnings (Sep) |
2.1% |
2.2% |
|
10:30 |
GBP |
Claimant Count Change(Oct) |
2.3K |
1.7K |
|
10:30 |
GBP |
Unemployment Rate (Sep) |
4.3% |
4.3% |
|
14:30 |
USD |
Core CPI(MoM)(Oct) |
0.2% |
0.1% |
|
14:30 |
USD |
Core Retail Sales(MoM)(Oct) |
0.2% |
1.0% |
|
16:30 |
USD |
Crude Oil Inventories (Nov 10) |
-2850K |
2237K |
UK’s employment report is released at 10:30 CET. Uncertainty surrounding Theresa May and inflation missing the Bank of England’s 3.1% forecast put pressure on the cable yesterday. Average earnings including bonus are forecasted to rise 2.1% in September from 2.2% in the 3-month period up to August. Claimant count is expected to rise to 2.3K, while the unemployment rate is to remain unchanged at 4.3%. A slowdown in earnings is likely to put more pressure on the pound even if other employment figures are solid as the recent rate hike would become increasingly questionable.
In the afternoon, US Core CPI is expected to rise 0.2% month-over-month. Core Retail sales are forecasted to rise 0.2% month-over-month. EIA crude inventories are expected to decline by 2.85 million barrels in the week ending November 10th after having risen by 2.2 million a week earlier.
Technical Analysis
EURUSD (Daily timeframe)
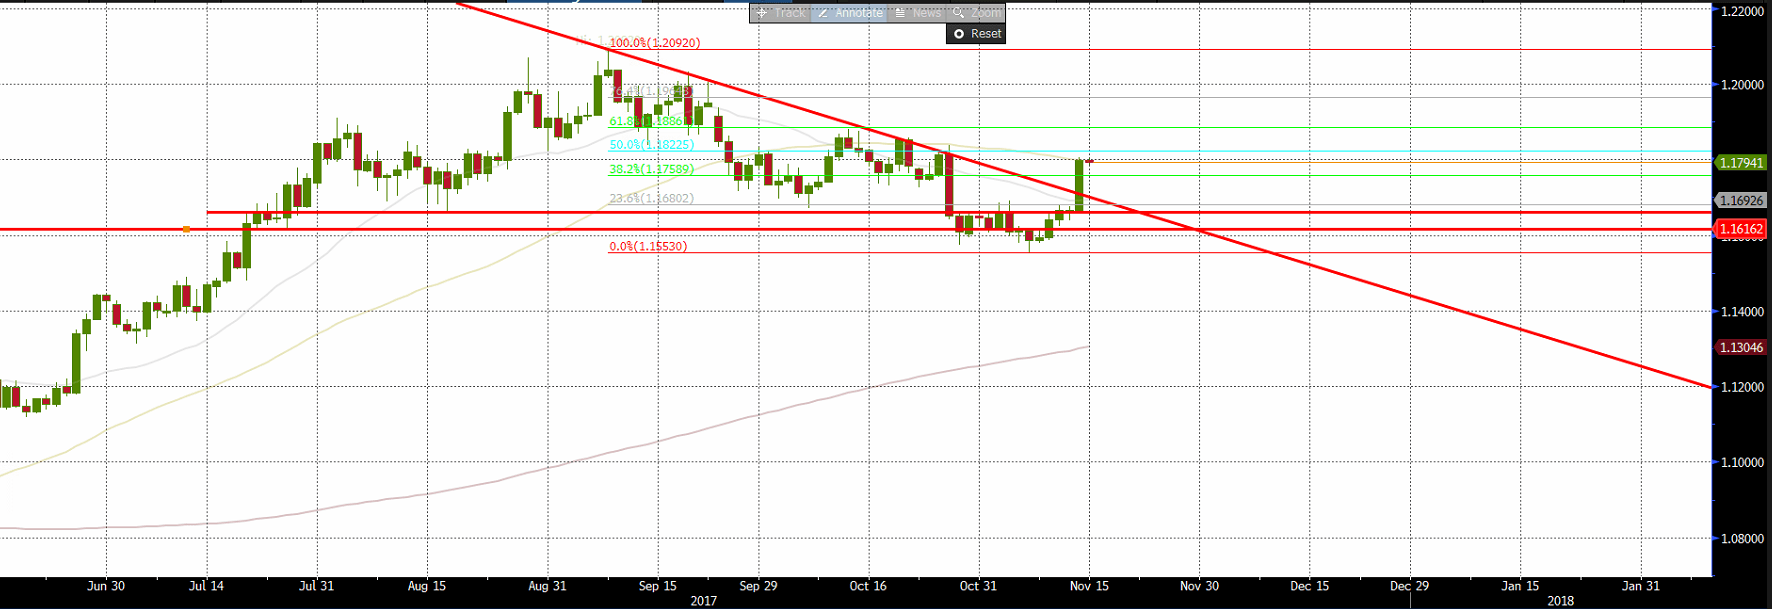
EURUSD rallied and made several breakouts. Now is testing its 55MA daily and above this level it could test the 61.8% Fibonacci retracement of the downtrend wave that started from its 2017 top 1.2092. The 61.8% level is at near 1.1890. Above this area the 2017 could be tested again. Below 1.1630 EURUSD could test again 1.1553.
GBPUSD (Daily timeframe)
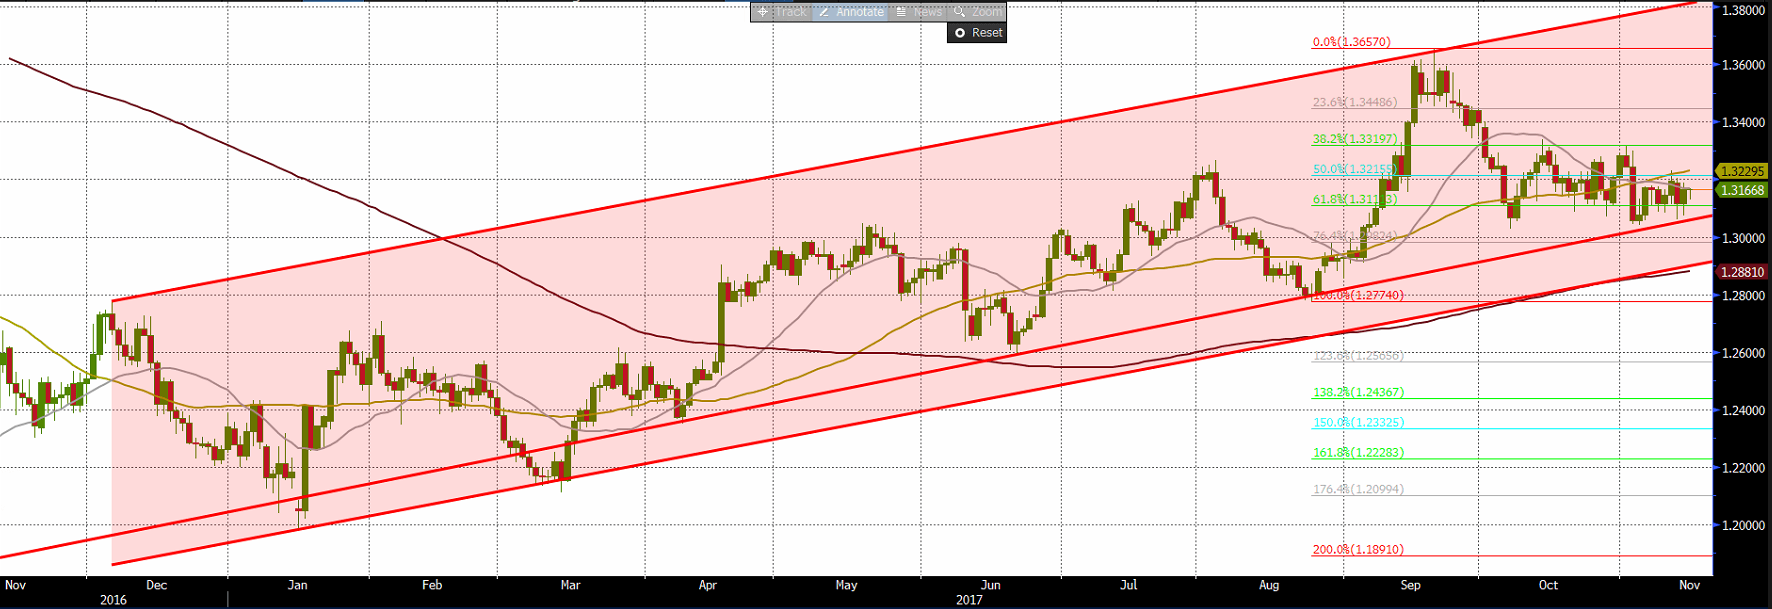
GBPUSD rebounded and it may rise above the 21 and the 55 MA. A breakout of 1.3240 could lift the pair to 1.3320 and if market sentiment would continue to be positive GBPUSD could test the higher side of the channel or its 2017 top. Below 1.3020 GBPUSD could slide to 1.2870. Beneath this level the pair could test 1.26.
BUND Futures (Daily timeframe)
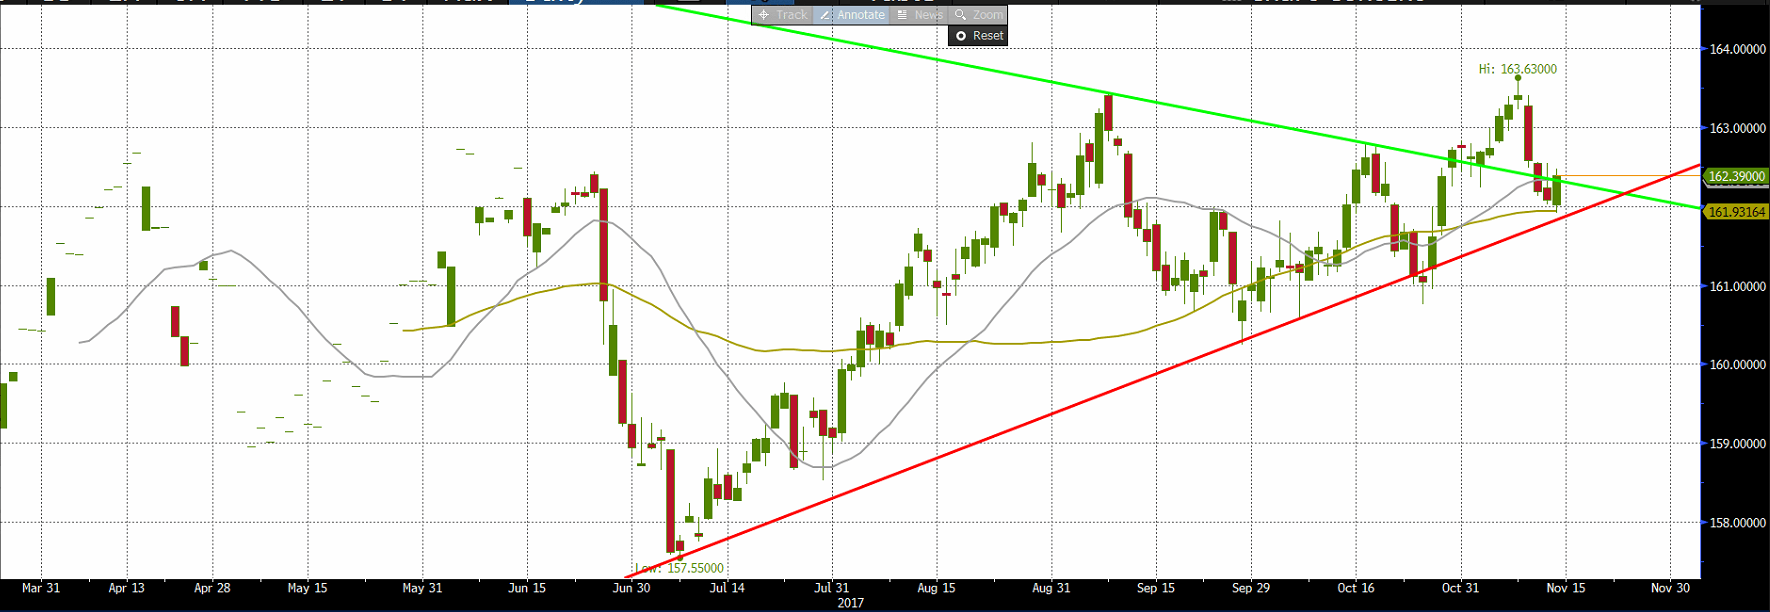
Bund future prices bounced on a rising trendline and closed more than 30 points higher. Resistance at 162.77 lies ahead of a multi week high by 163.63. A break of the trendline lower could lead to further weakness to 160.75 or 160.
DAX (Daily timeframe)
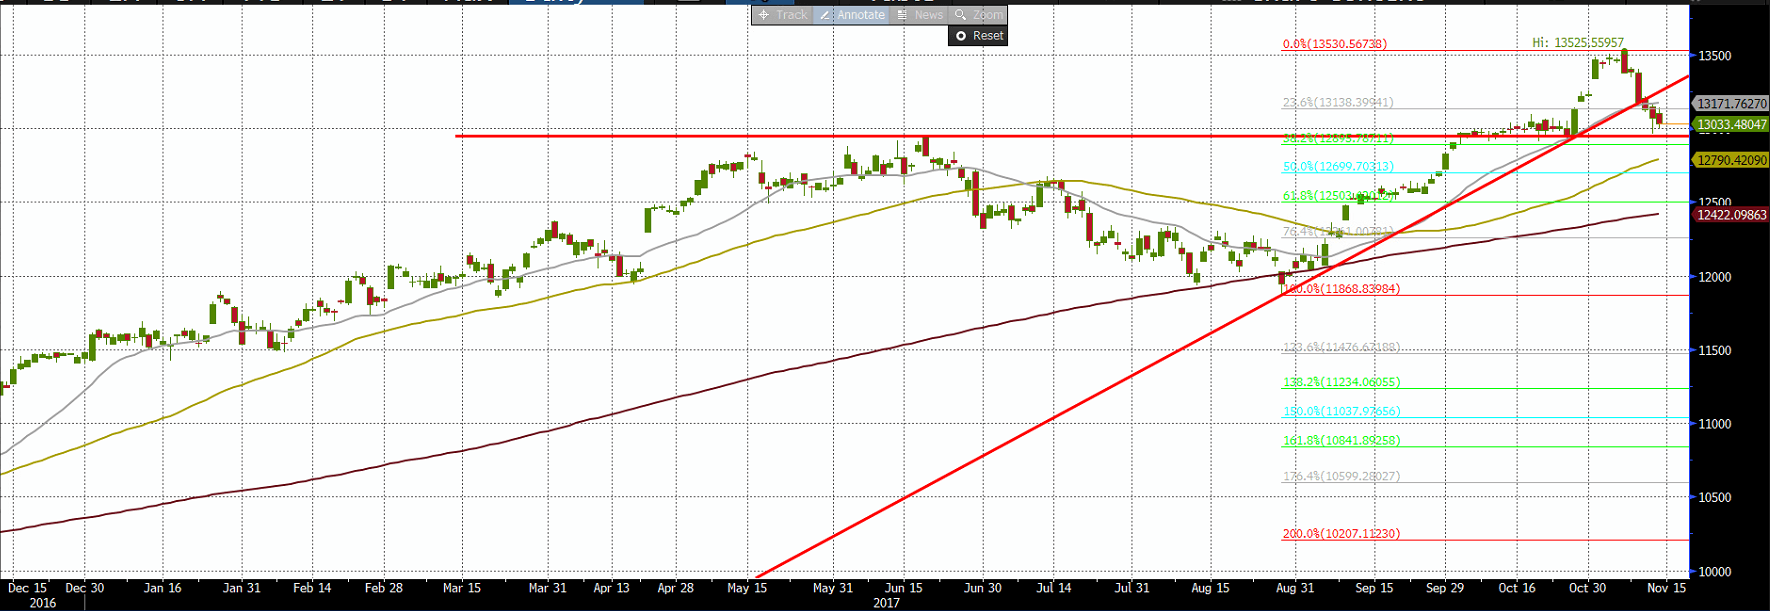
DAX sits on a key support, and a bounce here could trigger a continuation of the strong bullish run dating back to early 2016. At 12900 sits the confluence of a classic support area at the June 2017 high and the 38.2% Fibonacci retracement of the August lows to November high move. A break lower should give bulls cause for concern and set a deeper pullback.
FTSEMIB (Daily timeframe)
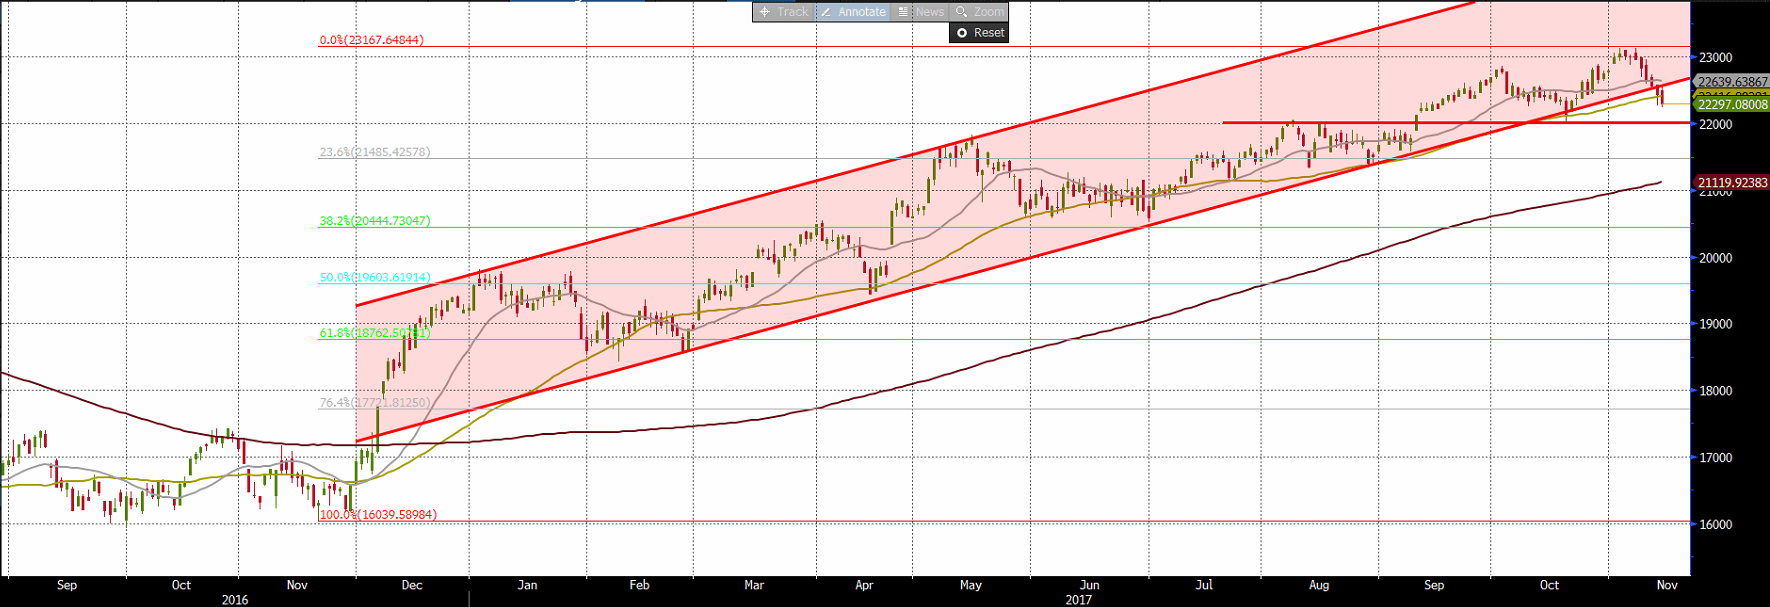
FTSEMIB extended its decline and closed below 23000. Key support remains at 22000, with a break paving the way for a drop to the 38.2% Fibonacci retracement of the November 2016 low to this year’s peak at 20444. A move to the upside could face resistance at 22860 ahead of 23133 peak.
Author

ALB Team
ALB Forex Trading
ALB Research Department is the research department of ALB Forex Trading Ltd.


